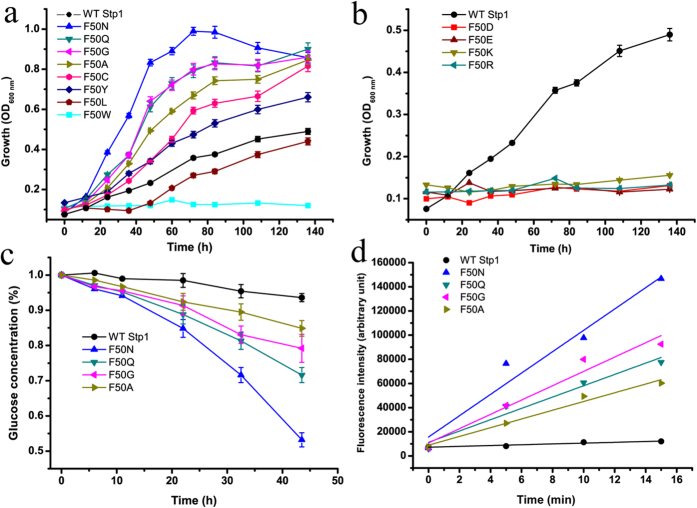
Figure 5. The effect of site-directed mutagenesis of Phe 50 on the glucose- and 2-NBDG-transport capabilities of Stp1.
(a,b) Growth curves of yeast cells expressing the respective variants of Phe 50 as indicated with 1% glucose as the sole carbon source. (c) HPLC analysis of the residual glucose in the culture supernatants of the yeast cells expressing the respective variants. (d) Fluorometric analysis of 2-NBDG uptake by the respective variants, obtained by measuring the fluorescence intensity of the yeast transformants incubated with 2-NBDG for the indicated time period. Values in all the panels are the mean of three biological replicates.

