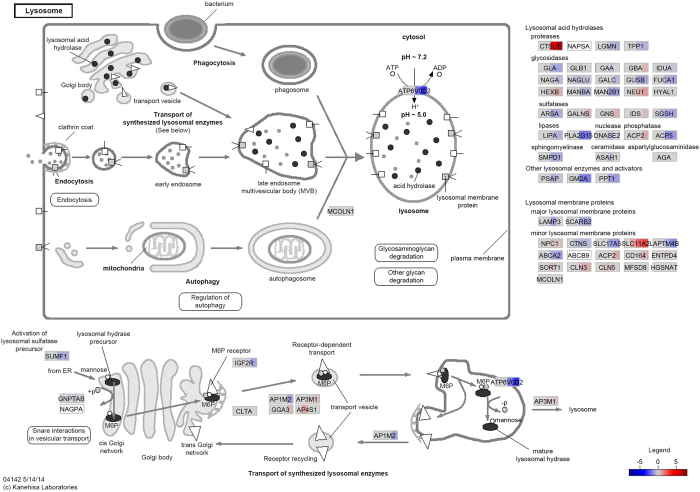
Figure 3. Lysosome pathway.
The Lysosome pathway is represented with gene expression (log2 fold-change) values overlaid at all post-infection time points; shown from left to right are the 2, 6, 24 and 48 hpi time points, respectively. The colour intensity corresponds to the level of upregulation (red) or downregulation (blue) in the M. bovis-infected versus the control non-infected alveolar macrophages. Genes coloured in grey were not significantly DE and genes coloured in white were filtered out due to low expression.

