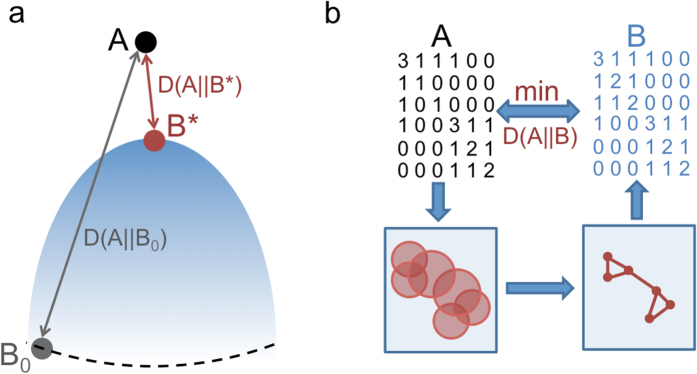
Figure 1. Illustration of our data representation framework.
(a) For a given A input matrix, our goal is to find the closest B representation, measured by the  Kullback-Leibler divergence. The trivial representation, B0, is always at a finite
  value, limiting the search space. (b) In the data representation example of network visualization, we assign a distribution function to each network node, from which edge weights (B) are calculated based on the overlaps of the distributions. The best layout is given by the representation, which minimizes the
  description length.

