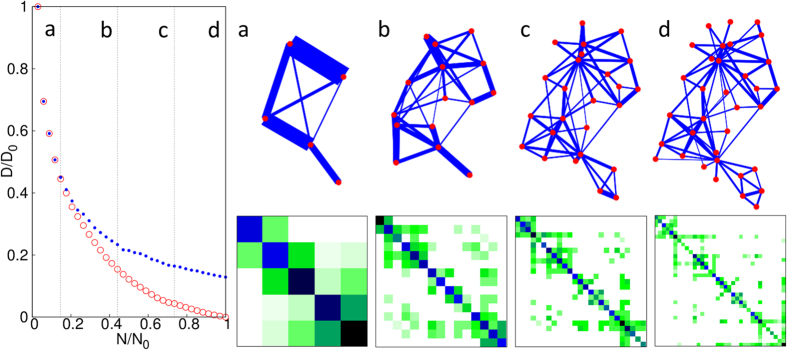
Figure 3. Illustration of our hierarchical visualization technique on the Zachary karate club network52.
In our hierarchical visualization technique the coarse-graining procedure guides the optimization for the layout in a top-down way. As the N number of nodes increases, the relative entropy of both the coarse-grained description (red, ○) and the layout (blue, ●) decreases. The panels (a–d) show snapshots of the optimal layout and the corresponding coarse-grained input matrix at the level of N = 5, 15, 25 and 34 nodes, respectively. For simplicity, here the hi normalization of each distribution is kept fixed to be ∝ ai* during the process, leading finally to η = 4.4%.

