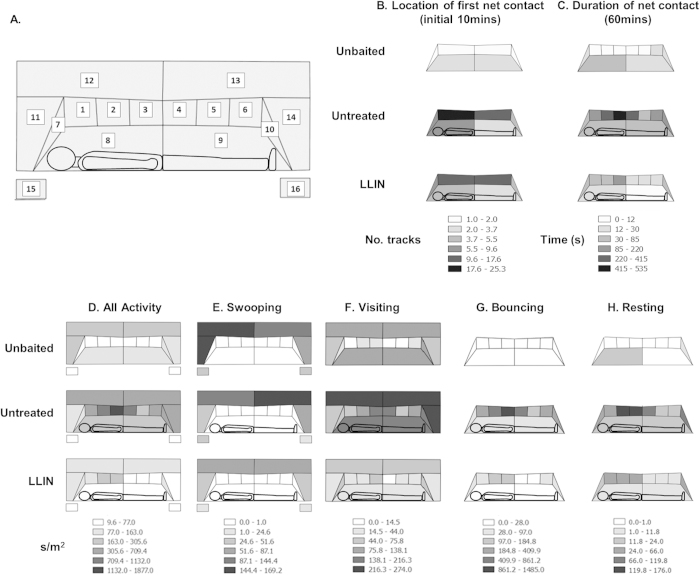
Figure 2. Distribution of Anopheles gambiae flight activity, behaviour modes and net contact at different regions on and around a bed net.
(A) Distribution map key showing region codes to which each mosquito track was assigned. Bed net surfaces 1–6 were on the horizontal roof, 7 and 10 the vertical head and foot end walls, respectively, 8 and 9 the vertical side walls. Portions of flight tracks visible beyond the net surfaces were assigned to the spatial regions 11–14 as shown. Regions 15 and 16 record flight activity without net contact (i.e. swooping) that occurred in front of net, on the left (15) and right (16) portions of the field of view, respectively. (B) Distribution of initial net contacts by region, showing the first point of net contact for those tracks occurring in the first ten minutes of testing. (C) The total duration (seconds) of all contacts (includes mid-flight brief contacts made during visiting and bouncing, and resting behaviour) by all mosquitoes on each region of the bed net surface over the 60 minute test (means of 3,10 and 10 replicate tests for unbaited, baited and LLIN, respectively). Charts D–H show the density of activity (s/m2) around and on the bed net surface: (D) All activity combined; (E) Swooping; (F) Visiting; (G) Bouncing; (H) Resting. Although tests controlled for the orientation of the human bait in relation to the mosquito release point, all figures show the volunteer (when present) with the head on the left.

