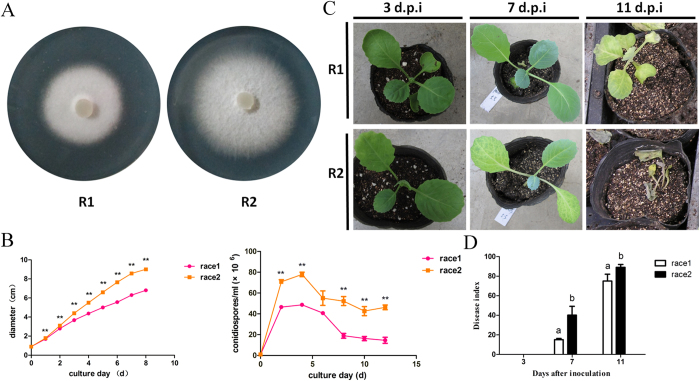
Figure 1. Comparison of growth and pathogenicity between R1 and R2: (A) the growth of Fusarium oxysporum f. sp conglutinans R1 and R2 after a 5-day culture on PDA media; (B) the growth rates and conidial concentrations of R1 and R2.
Each data point represents the average of three independent biological replicates. The average is shown with the SE of the mean. ** represents the significant differences at p < 0.01; (C) the disease symptoms induced by R1 and R2 of Foc on Chinese cultivar “Zhong Gan 21”. The cabbage seedlings are shown at 3, 7, 11 days after inoculation; (D) the disease index analysis for cabbage seedlings inoculated with R1 and R2 at 3, 7, 11 days after inoculation. Each value of the disease index is the average of three independent biological replicates. Each test on the disease index was performed on more than thirty seedlings. The values followed by different letters were significantly different according to Duncan’s multiple range tests at p < 0.01.

