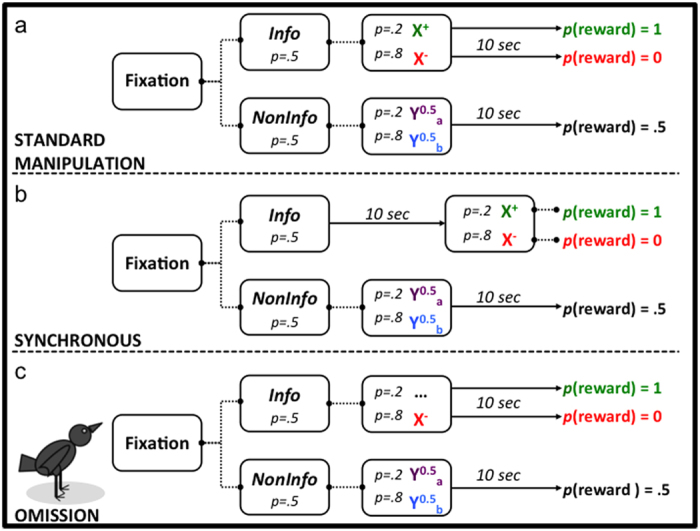
Figure 1. Design of Experiments 1 and 2.

Dotted lines indicate no delay between consecutive events and solid lines indicate a 10 s delay. p denotes probability.

Dotted lines indicate no delay between consecutive events and solid lines indicate a 10 s delay. p denotes probability.