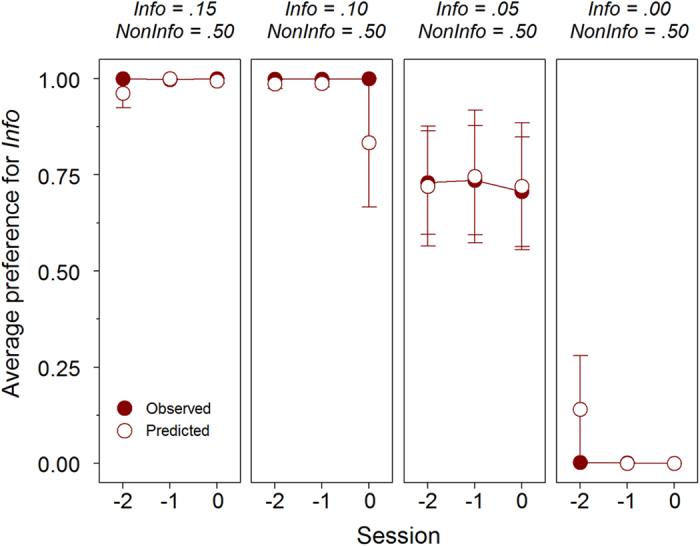
Figure 3. Average preference for the Info option with different reward probabilities in Experiment 1.

Mean proportion of observed and predicted preferences according to the Sequential Choice Model (±s.e.m.) for the Info option during the last three sessions at each reward probability (n = 6).
