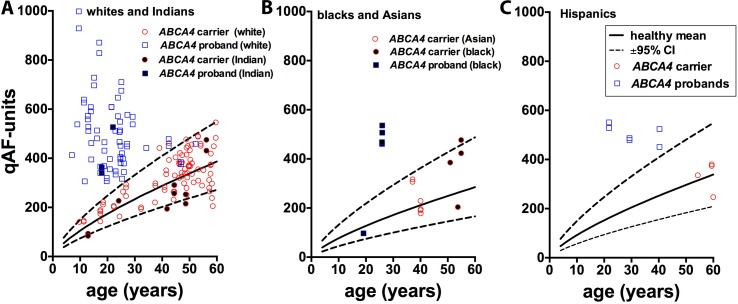
Figure 3.
Quantitative fundus autofluorescence intensities plotted as a function of age. Values are the mean of the 8 segments (qAF8) shown in Figure 1 and measured in carriers of ABCA4 mutations (red circles), ABCA4-affected patients (blue squares), and subjects with healthy eyes (mean, solid line; upper and lower limits [95% confidence level], dotted lines) of (A) whites (unfilled symbols) and Indians (filled symbols), (B) blacks (filled symbols) and Asians (unfilled symbols), and (C) Hispanics. The values for Indian carriers and probands are plotted with white subjects because the upper 95% CI of whites and Indians is similar.28 Values for both eyes or one eye (23 carriers and 11 affected patients) are plotted.

