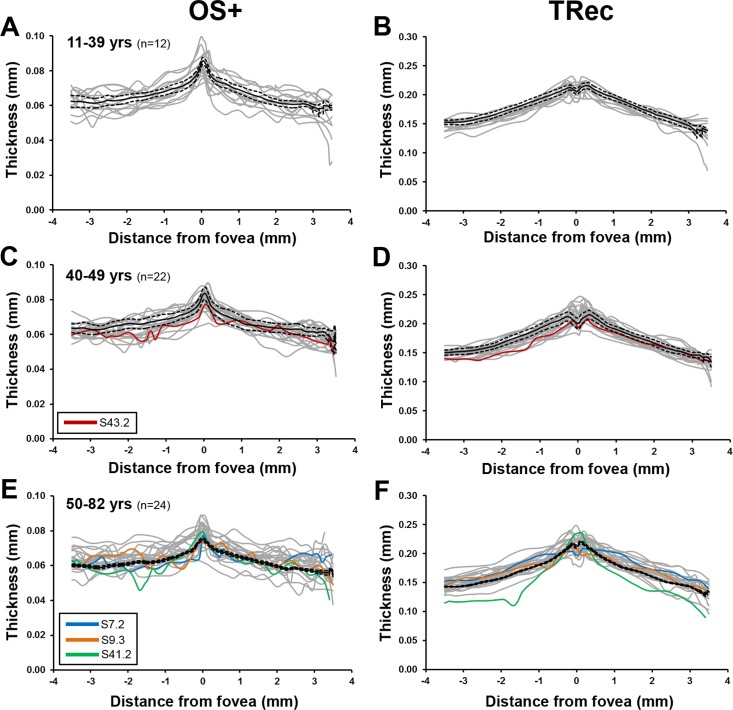
Figure 7.
Thickness profiles acquired by segmentation of spectral-domain optical coherence tomography (SD-OCT) images of carriers of ABCA4 mutations. Profiles are shown in color for carriers S43.2, S7.2, S9.3, and S41.2; these carriers presented with qualitative fundus changes in SW-AF and SD-OCT as shown in Figure 6. Thickness profiles of individual carriers are shown as gray lines. Thickness profiles of controls are presented as mean (black solid line) ± 95% confidence intervals (mean ± 1.96× standard error of mean [SEM]; [1.96× SD/√(n-1)]; black dashed lines). Thicknesses of OS+ layer (from EZ to border between Bruch's membrane and choroid) (A, C, E) and TRec (from border between inner nuclear layer and outer plexiform layer to border between Bruch's membrane and choroid) (B, D, F) are presented as a function of distance from the fovea. Right eyes are presented. Subjects are grouped by ages, and numbers of carriers in each group (n) are indicated.

