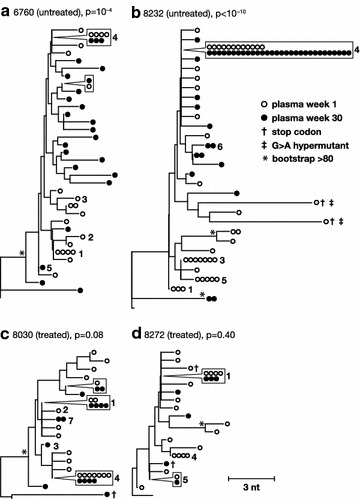
Fig. 2.

Phylogenetic and panmixia relationships between single-genome plasma sequences obtained one week and 30 weeks post-infection from each animal. Neighbor-joining trees were prepared using consensus B as an out group (bottom, unlabeled branch) for the untreated (a, b) and treated (c, d) animals. The p values shown next to each animal identifier denote the probability that the virus populations sampled at one week and 30 weeks after infection are not different (panmixia). Numbers refer to clusters of sequences observed more than once here and in previous and subsequent figures. Symbols shown in boxes indicate identical sequences that are present on the tree at the location indicated by the pointer. G to A hypermutants are marked by crosses. Asterisks indicate bootstrap values >80
