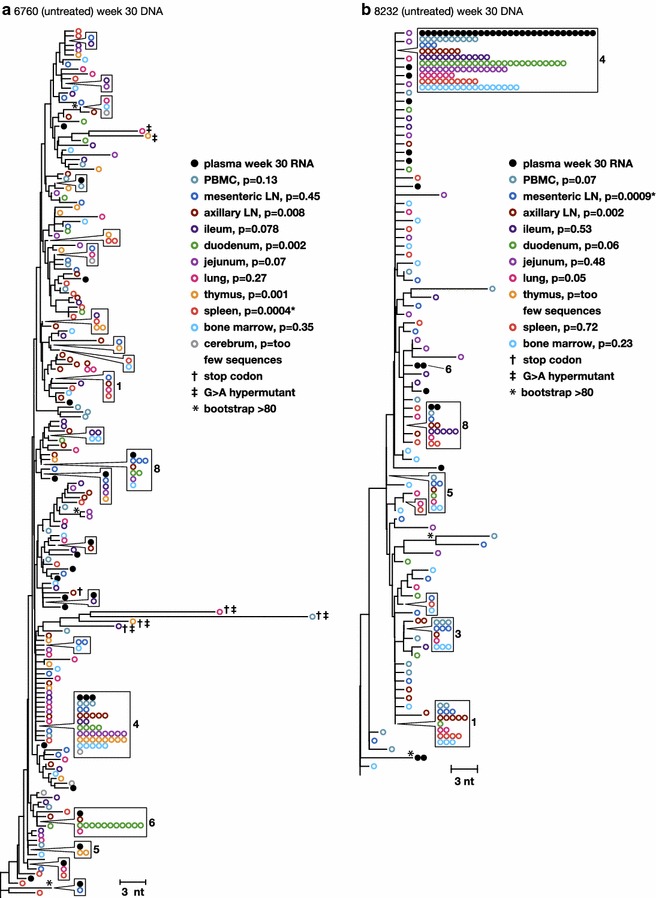
Fig. 3.

Phylogenetic relationships between single-genome proviral sequences obtained from various anatomical compartments 30 weeks post-infection from the untreated animals a 6760 and b 8232. The panmixia probabilities comparing virus populations in the tissues (open colored circles) with sequences in the plasma (solid black circles) are shown next to each tissue in the key. G to A hypermutants are marked by crosses. Numbers refer to clusters of sequences observed more than once here and in previous and subsequent figures. Symbols shown in boxes indicate identical sequences that are present on the tree at the location indicated by the pointer
