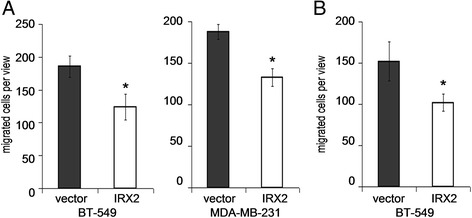
Fig. 5.

Analysis of cell migration. a Migration analysis of parental BT-549 and MDA-MB-231 cells using Boyden chamber assay. Cell culture supernatants from BT-549 cells over expressing IRX2 or from control cell lines were used as chemoattractant for 24 h. Error bars represent the standard deviation of the mean of three independent experiments done in triplicates. P-values were calculated by the two-sided Student’s t-test (*, p < 0.05). b Migration analysis of BT-549 cells over expressing IRX2 and from control cells using Boyden chamber assay Standard cell culture medium was used as chemoattractant for 24 h. Error bars represent the standard deviation of the mean of three independent experiments done in triplicates. P-values were calculated by the two-sided Student’s t-test (*, p < 0.05)
