
. 2015 Nov 11;15:90. doi: 10.1186/s12911-015-0213-z
© McMeekin et al. 2015
Open AccessThis article is distributed under the terms of the Creative Commons Attribution 4.0 International License (http://creativecommons.org/licenses/by/4.0/), which permits unrestricted use, distribution, and reproduction in any medium, provided you give appropriate credit to the original author(s) and the source, provide a link to the Creative Commons license, and indicate if changes were made. The Creative Commons Public Domain Dedication waiver (http://creativecommons.org/publicdomain/zero/1.0/) applies to the data made available in this article, unless otherwise stated.
Fig. 1.
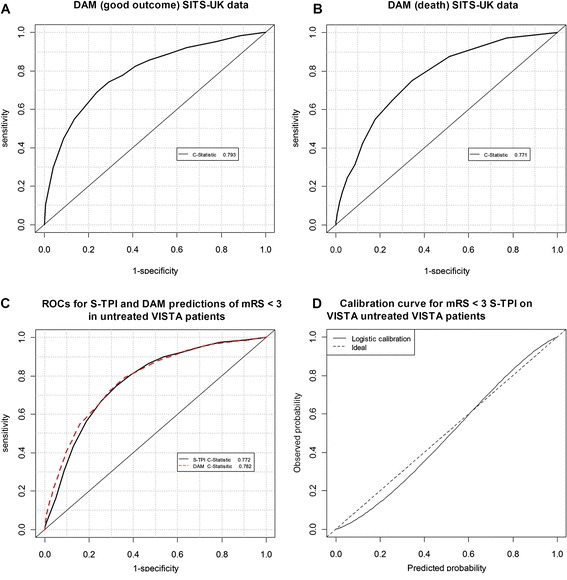
ROC curves for the calibrated S-TPI for treated (A&B) and untreated patients (C&D)