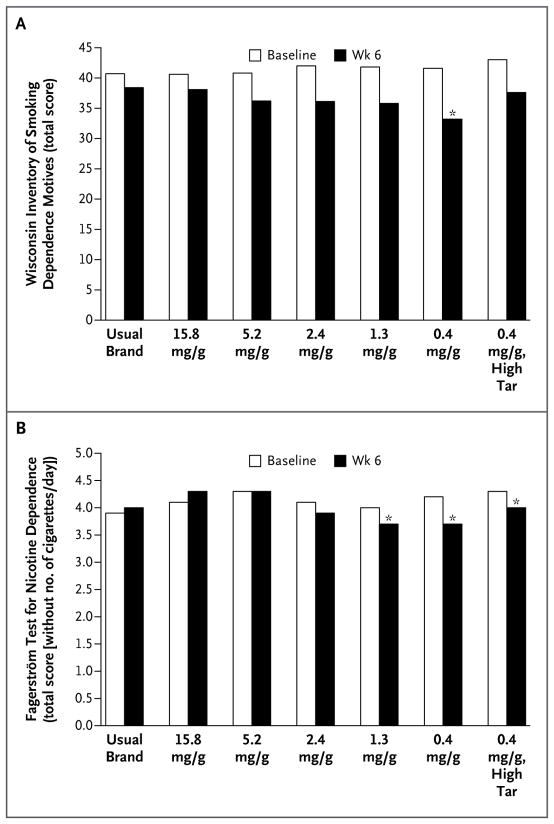
Figure 3. Nicotine Dependence According to the Nicotine Content of Cigarettes.
Panel A shows total scores on the Wisconsin Inventory of Smoking Dependence Motives (score range, 11 to 77, with higher values indicating greater dependence), which is a multifactorial scale of nicotine dependence. Panel B shows total scores on the Fagerström Test for Nicotine Dependence, with the item concerning number of cigarettes smoked per day excluded (score range after exclusion of that item, 0 to 7, with higher values indicating greater dependence). All analyses were adjusted for the baseline score. An asterisk indicates P≤0.002 for the comparison at week 6 with cigarettes containing 15.8 mg of nicotine per gram.

