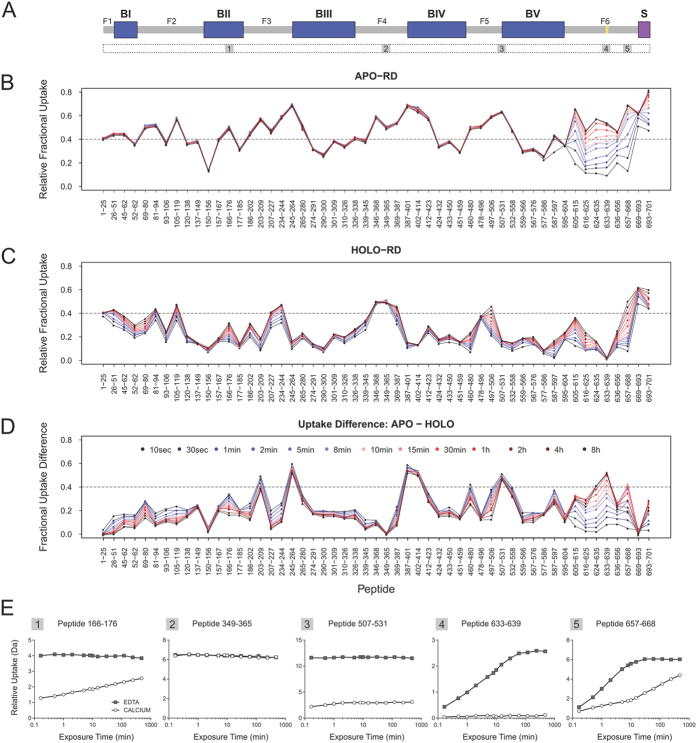
Figure 5. Exchange behavior of the RD protein in Apo- and Holo-states.
(A) Schematic representation of the RD protein showing the position of the five blocks containing RTX motifs (BI to BV; colored in blue) and of the flanking regions (F1 to F5; colored in gray). The F6 region is highlighted in red, the Block A in yellow, and the secretion signal (S) in purple. The positions of the five peptides shown in panel D are displayed below this scheme. (B,C) Profiles of RD in both the Apo- and Holo-state. The relative fractional exchange data calculated at each time point was plotted as a function of peptide position. Relative fractional exchange values were determined as described in the experimental section. The red to blue lines correspond to data acquired form 10 sec to 8 h deuteration, respectively (see color legend in panel D). Each dot corresponds to an average of three independent HDX-MS experiments. (D) Fractional uptake difference plot showing the differences in uptake calculated between Apo- and Holo-RD at each time point, and for each peptide. A high uptake difference value indicates a calcium-induced protective effect, while a low value is indicative of a weak effect of calcium binding. (E) Deuterium uptake curves for selected peptides in the Apo- (filled squares) and the Holo- (open circles) states. Each example illustrates a unique HDX behavior, as monitored during the time course of our experiment.

