
Figure 5.
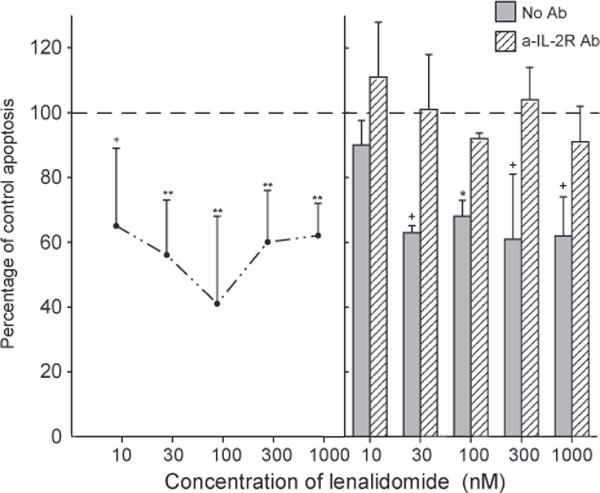
Suppression of activation-induced T cell apoptosis by lenalidomide: dependence on IL-2 signaling. Each point and bar in the left-hand frame and each column and bar in the right-hand frame depict the mean ± S. D. of the results of apoptosis assays of activated T cells from the same five old subjects as in Figure 4. Incubation with anti-CD3 antibody was for two days (right-hand frame) or three days (left-hand frame) without (control = 100%) or with lenalidomide. The mean ± S.D. of control values was 0.599±0.121 AU (405 nm–490 nm). Statistical significance was calculated and depicted as in Figure 1, with comparisons between values with lenalidomide and the 100% control for points in the left-hand frame and between values without and with a-IL-2 R monoclonal antibody for each set of two columns in the right-hand frame.