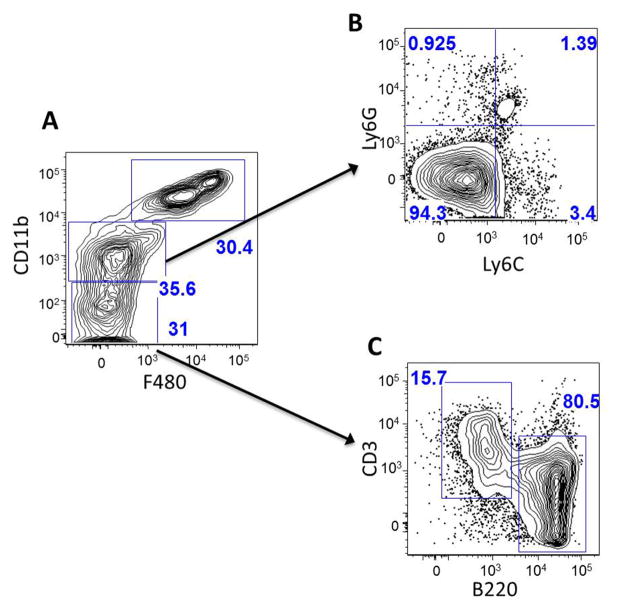
Fig. 1. Characterization of lavaged leukocytes by FACS analysis.
A. Whole lavage sample. Upper right gate (30.4%) represents CDllb-high & F4/80-high cells, which are large peritoneal macrophages (LPM). The middle gate (35.6%) represents CDllb-intermediate and F4/80-negative cells. This fraction of cells was further probed for expression of Ly6G and Ly6C (B). 94.3% of these cells were Ly6G-negative and Ly6C-negative, indicating that they are small peritoneal macrophages (SPM). The bottom gate of panel A denotes CDllb-negative and F4/80-negative cells. This fraction was further probed for markers of B-cells (B220) and T-cells (CD3) (C). 80.5 percent of these cells were B-cells and 15.7% were T-cells. Overall, this analysis indicates that the lavage cells consist of ~60% macrophages (LPM and SPM), ~30% lymphocytes (most of which are B-cells), and 10% other cells.

