
Figure 1. EGCG inhibits ER+ PR+ cancer cell proliferation.
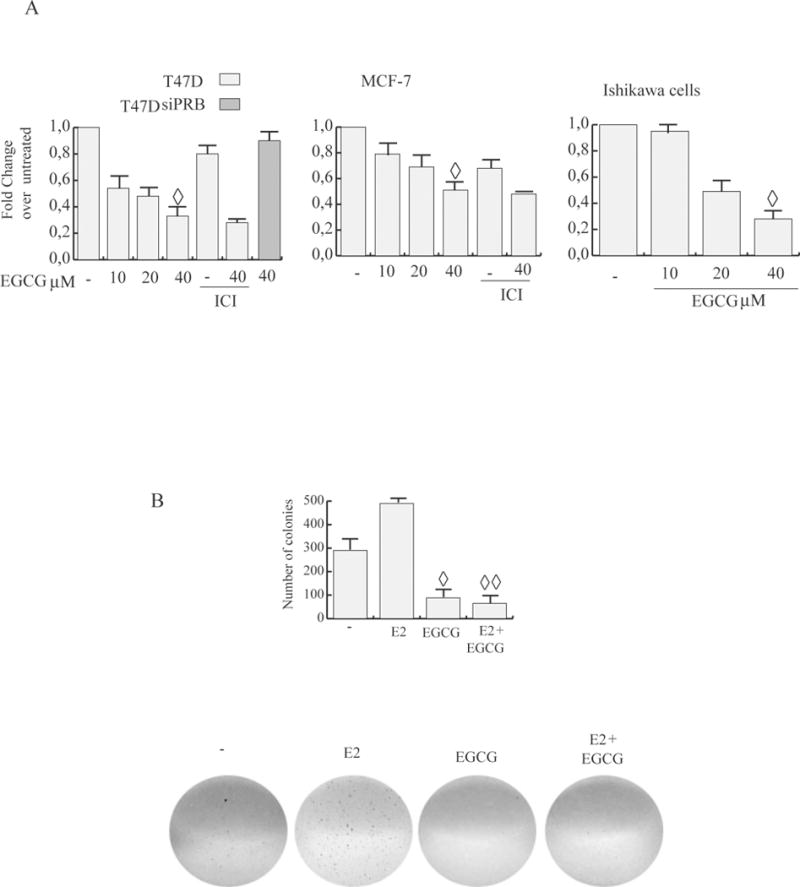
A, MTT assay. Cells, serum starved, were exposed to vehicle (−), or 1 μM ICI and/or different concentrations of EGCG in medium containing 1% dextran charcoal-stripped FBS for 4d (treatments were renewed every 2d). Results indicate mean of three independent experiments done in triplicate; bars SD;◊ P<0.05 compared with untreated cells. B, EGCG blocks E2 induced anchorage independent growth of T47D. Soft agar colony formation assay was performed in control conditions (−), or in the presence of 10 nM estrogen (E2) and/or 40 μM EGCG. Cells were allowed to grow for 14 d and the number of colonies ≥50 μm were quantified. bars SD;◊ P<0.05 compared with untreated cells; ◊◊ P<0.05 compared with E2 treated cells. Pictures at the bottom show typical well for each condition.