
. 2015 Oct 5;17(10):e224. doi: 10.2196/jmir.4871
©Noah Wayne, Daniel F Perez, David M Kaplan, Paul Ritvo. Originally published in the Journal of Medical Internet Research (http://www.jmir.org), 05.10.2015.
This is an open-access article distributed under the terms of the Creative Commons Attribution License (http://creativecommons.org/licenses/by/2.0/), which permits unrestricted use, distribution, and reproduction in any medium, provided the original work, first published in the Journal of Medical Internet Research, is properly cited. The complete bibliographic information, a link to the original publication on http://www.jmir.org/, as well as this copyright and license information must be included.
Figure 7.
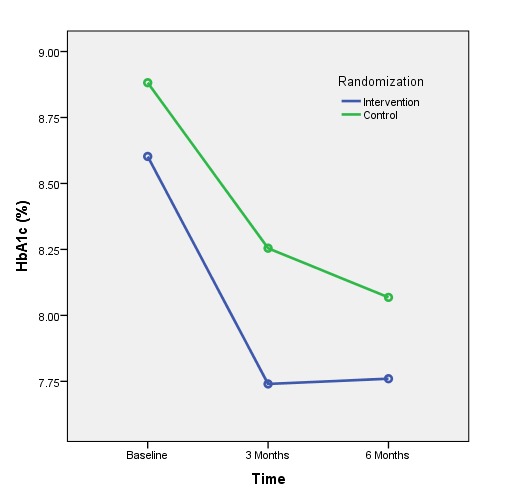
HbA1c levels for the control and intervention groups over time.