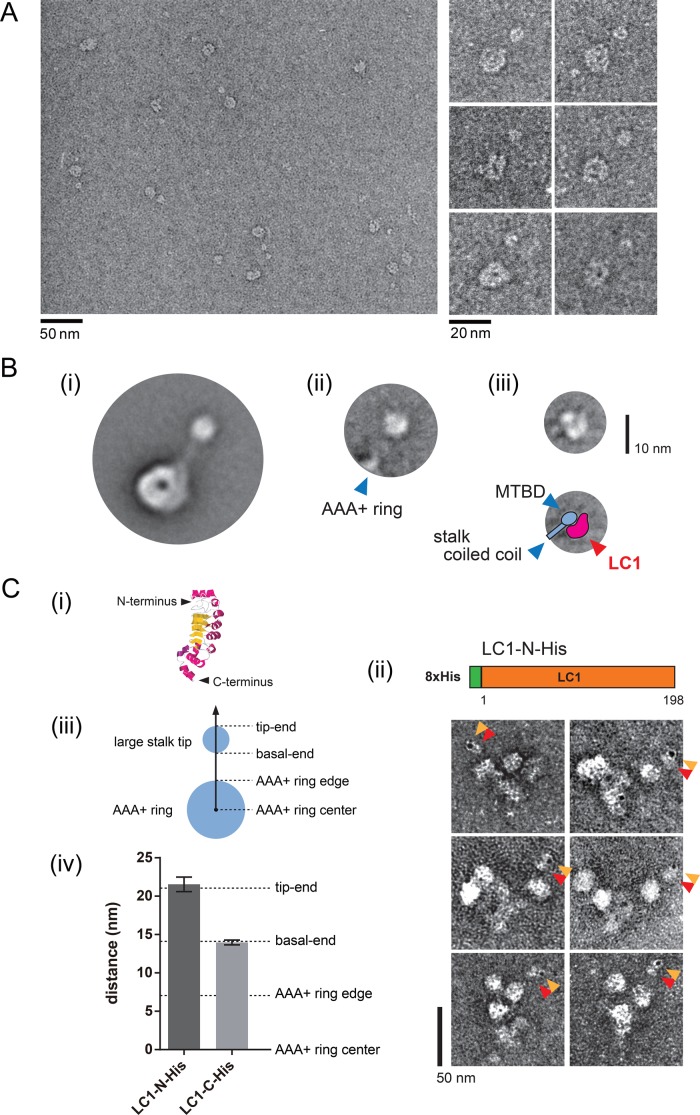
FIGURE 3:
Structural analysis of the stalk tip. (A) EM images of the Tetrahymena DYH3 head fragment. General view (left) and selected EM images (right) of negatively stained DYH3 head fragment (which corresponds to the Chlamydomonas γ head). (B) Single-particle analysis of the Tetrahymena DYH3 head fragment. (i) Major class average of the Tetrahymena DYH3 head. A round structure was found at the stalk tip. (ii) Representative class average of the stalk region. The major class in (i) was subclassified and aligned according to the stalk region by applying a mask to most of the AAA+ ring region. See also Supplemental Figure S5B. Location of the edge of the AAA+ ring is shown by blue arrowhead. (iii) Representative class average of the stalk-tip region, showing substructures. Only the stalk-tip regions of the Tetrahymena DYH3 head were used for the averaging in (iii). See also Supplemental Figure S5C. Schematic diagram of our interpretation is shown below. Locations of MTBD and stalk coiled coil are indicated by blue arrowheads. An additional structure, possibly corresponding to LC1, is indicated by the red arrowhead. (C) Localization of the N- and C-termini of LC1 in a large stalk tip. (i) The previously reported NMR structure of LC1 (Protein Data Bank ID: 1M9L). The N-terminus and C-terminus of LC1 are indicated. (ii) Schematic diagram of the Chlamydomonas LC1-N-His construct and EM images of the gold-labeled LC1-N-His OAD complex. Orange arrowheads indicate gold particles, and red arrowheads indicate large stalk tips. (iii) Schematic diagram of the AAA+ ring and the large stalk tip. (iv) Comparison of the gold particle locations in the LC1-N-His and LC1-C-His OAD complexes. The distance between the center of the AAA+ ring and that of the gold particle was measured for the OAD complexes with LC1-N-His and LC1-C-His. The distances from the AAA+ ring center to the edge of the AAA+ ring, basal end, and tip end of the large stalk tip were measured as in the axis in C (iii) from EM images without gold particles and are indicated by dashed lines in the graph in (iv). The values were as follows: LC1-N-His, 21.5 ± 0.9 nm (n = 26); LC1-C-His, 14.0 ± 0.3 nm (n = 69); AAA+ ring edge, 7.0 ± 0.2 nm (n = 21); basal end, 14.1 ± 0.6 nm (n = 27); tip end, 21.1 ± 0.6 nm (n = 27) (mean ± SE).

