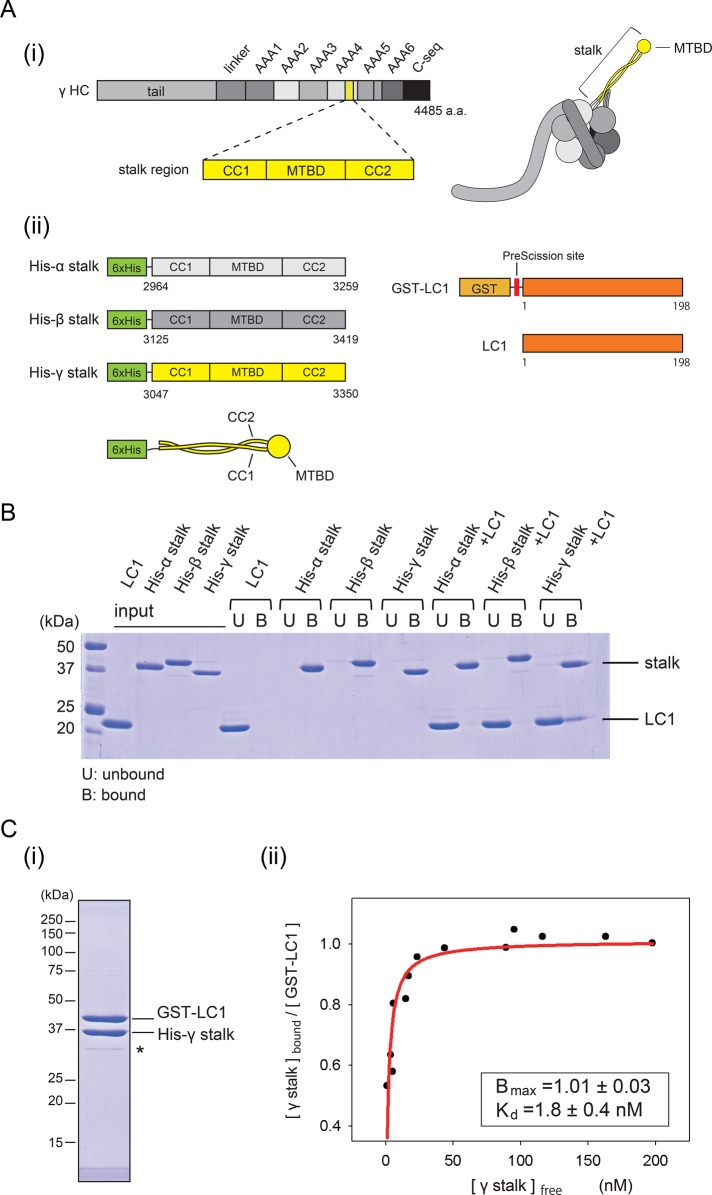
FIGURE 4:
Binding properties of LC1 to the stalk. (A) Constructs used for binding assay. (i) Schematic diagram of the γ HC sequence and protein structure. The stalk region is highlighted in yellow. (ii) Schematic diagrams of the stalk fragments and the LC1 constructs. His-α stalk, His-β, stalk and His-γ stalk are His-tagged stalk fragments constructed from Chlamydomonas α, β, and γ HCs, respectively. GST-LC1 designates GST-tagged, full-length Chlamydomonas LC1. LC1 denotes GST-tag removed LC1 by PreScission protease. The size of each construct is not drawn to scale. (B) Binding of LC1 and the stalk. Pull-down assays exploiting the His tag in the stalk constructs, analyzed by SDS–PAGE. The unbound fraction is indicated by U and the bound fraction by B above the image of the gel. (C) Stoichiometry and affinity of the binding of the γ stalk and LC1. (i) Result of tandem affinity purification. Affinity purification was sequentially performed using the His tag and GST tag. The intensity of the band possibly corresponding to a degradation product (indicated by an asterisk) was <5% of the two major bands and therefore does not significantly influence the result. (ii) Quantitative GST pull-down assay of His-γ stalk and GST-LC1. Increasing concentrations of the γ stalk were incubated with a fixed concentration of GST-LC1 and subjected to GST pull-down assay. The free γ stalk concentration in the unbound fraction and the molar ratio of γ stalk to GST-LC1 in the bound fraction were determined and plotted. The plot was fitted with the equation Y = Bmax × X/(Kd + X), where Bmax is the maximal binding ratio and Kd is the concentration at half-maximal binding. The binding was saturated at Bmax = 1.0 (molar ratio), with Kd = 1.8 nM (R2 = 0.81).

