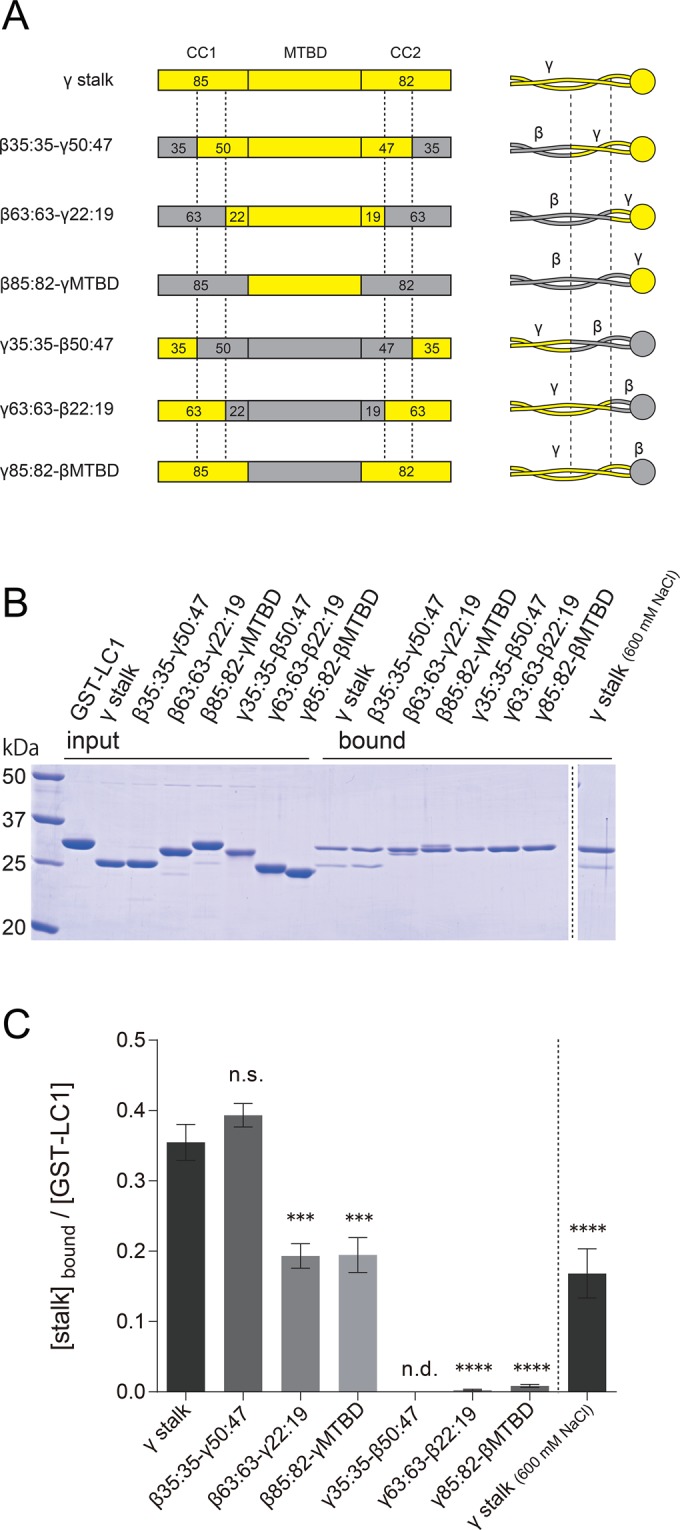
FIGURE 5:

Mapping of the LC1 binding region within the γ stalk. (A) Schematics of the sequences and structures of chimeric stalk constructs. Chimeric stalk constructs of γ HC (yellow regions) and β HC (gray regions) were designed and used for GST pull-down assays with GST-LC1. The junction sites in the stalk coiled coil are indicated by dashed lines. The nomenclature is based on the number of amino acid residues in CC1 and CC2, and the former and the latter parts of the name represent the numbers in the base and tip regions. For example, in β35:35-γ50:47, the base region (35 aa of CC1 and 35 aa of CC2) is β HC sequence, and the tip region (50 aa of CC1, MTBD, and 47 aa of CC2) is γ HC sequence. See also Supplemental Figure S7. The His tags at the N-termini, for purification purposes, are omitted from the diagram. (B) SDS–PAGE of GST pull-down assays of chimeric stalk constructs and GST-LC1. Binding of the stalk constructs and GST-LC1 was carried out in PBS containing 140 mM (left) and 600 mM (right) NaCl. (C) Quantification of the binding to GST-LC1. Ratios of stalk constructs and GST-LC1 in the bound fraction were calculated for each construct from SDS–PAGE results. GST pull-down assay was carried out in a concentration range in which the binding was not saturated. The mean values were calculated from three independent experiments, and error bars represent the SE. Statistical significances compared with the γ stalk (140 mM NaCl) were determined using one-way analysis of variance (ANOVA) followed by Dunnett's multiple comparisons test (***p < 0.001, ****p < 0.0001; n.s., not significant; n.d., not detected).
