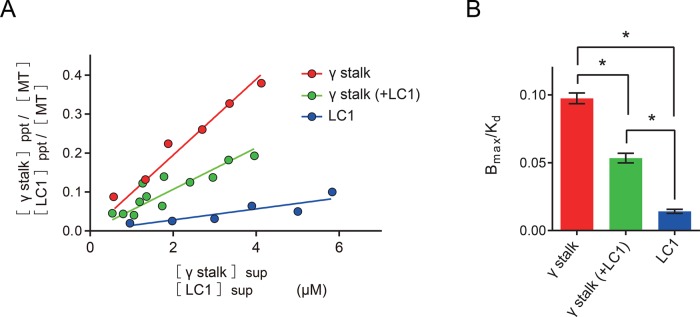
FIGURE 6:
Binding of γ stalk and LC1 to the microtubule. (A) The molar ratios of γ stalk and tubulin dimer in the precipitated fractions (ppt) are plotted against the free γ stalk concentrations in the supernatant fraction (sup) for γ stalk (red) and γ stalk-LC1 complex (green). The molar ratios of LC1 and tubulin dimer in the precipitated fraction and the free LC1 concentrations in the supernatant fraction are plotted for LC1 (blue). See also Supplemental Figure S8. When X < Kd, Y = BmaxX/(Kd + X) can be approximated by Y = BmaxX/Kd. Thus the slopes (Bmax/Kd) were determined from the linear curve fitting. (B) Comparison of affinities (Bmax/Kd) for microtubules. Error bars represent the SE in the fitting. The values of Bmax/Kd are also summarized in Table 1. Statistical analyses were performed using one-way ANOVA, followed by Tukey's multiple comparisons test (*p < 0.0001).

