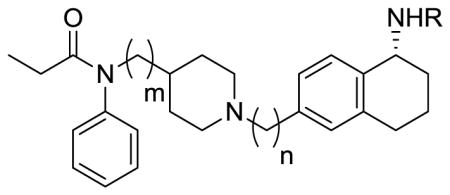
Table 1.
Binding Affinities of the Bivalent ligands at DOR and MOR

| |||||||||
|---|---|---|---|---|---|---|---|---|---|
| Compound | R | m | n | log IC50 | Binding Kib (nM) | log IC50 | Ki ratio μ/δ | aLogP | |
| MORa (μ) | DORa (δ) | ||||||||
|
| |||||||||
| 1 | H | 1 | 1 | −5.88 ± 0.16 | 580 | 6000 | −9.56 ± 0.30 | 1/10 | 4.17 |
|
| |||||||||
| 2 | H | 0 | 2 | −5.76 ± 0.39 | 760 | >10000 | n.d. | 1/13 | 4.04 |
|
| |||||||||
| 3 | H | 0 | 1 | −7.02 ± 0.11 | 40 | 10000 | n.d. | 1/250 | 3.53 |
|
| |||||||||
| 8 | H-Tyr-DAla-Gly-Phe | 1 | 1 | −7.67 ± 0.10 | 10 | 320 | −6.16 ± 0.14 | 1/32 | 4.88 |
|
| |||||||||
| 9 | H-Tyr-DAla-Gly-Phe | 0 | 2 | −7.65 ± 0.12 | 10 | 720 | −5.80 ± 0.11 | 1/72 | 4.87 |
|
| |||||||||
| 10 | H-Tyr-DAla-Gly-Phe | 0 | 1 | −8.23 ± 0.03 | 3 | 370 | −6.10 ± 0.06 | 1/122 | 4.61 |
|
| |||||||||
| 16 | H-Tyr-DAla-Gly-Phe-βAla | 0 | 1 | −8.89 ± 0.03 | 1 | 34 | −7.14 ± 0.08 | 1/34 | 4.32 |
|
| |||||||||
| 17 | H-Dmt-DAla-Gly-Phe-βAla | 0 | 1 | −9.56 ± 0.30 | 0.1 | 0.5 | −8.92 ± 0.04 | 1/5 | 4.45 |
|
| |||||||||
| Fentanyl | 5.9 | 570 | |||||||
|
| |||||||||
| YD | 2.8 | 300 | |||||||
|
| |||||||||
| AGFNH2 | |||||||||
Competition assays were carried out using rat brain membranes.
Competition against radiolabeled ligand, data collected from at least 2 independent experiments
n.d.: not determined.
