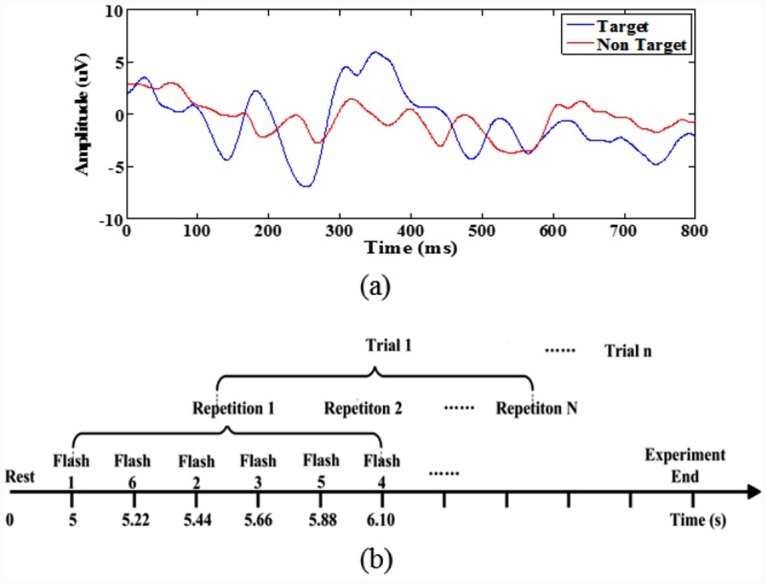
Fig 5. P300 ERPs and our flashing timeline for the P300 model.

(a) A P300 potential, which exhibits a large positive deflection at approximately 300 ms, as represented by the blue curve, is recorded in channel Pz when a subject is staring at a flashing target image. (b) Throughout the flashing timeline, the P300 Speller Stimulator toolbox presents the six visual stimuli one by one in a random order.
