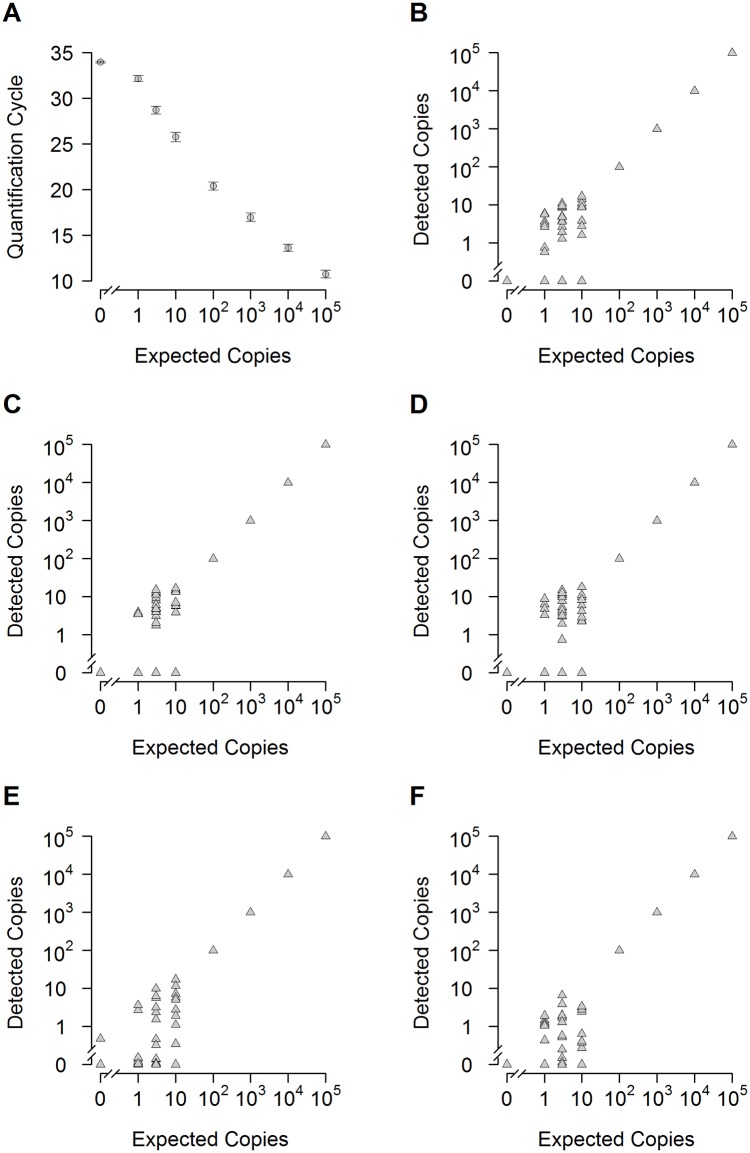
Fig 4. Sensitivity of the BRAF V600E assay against a background of 200 000 wild type copies.
The sensitivity of detection was analyzed with spike-in experiments. DNA from a melanoma cell line harboring the BRAF V600E mutation was spiked against a vast background of DNA from wild type cells (PBMCs). The background DNA equals 2 × 10⁵ copies of wild type BRAF. Number of spiked BRAF V600E copies is shown on the x-axis (logarithmic). (A) Quantification cycle of the qPCR (y-axis) is plotted versus the log concentration of mutant DNA per reaction. Circles depict the average Cq value of multiple reactions of five independent experiments (see (B-F)): 0, 1, 3 copies, n = 120; 10 copies, n = 50; 100-105 copies, n = 15). Error bars depict standard error of the mean. (B-F): Scatter plots of five independent spike-in experiments with the number of detected copies shown on the y-axis (logarithmic). Spiked copies are shown on the x-axis (logarithmic). Triangles show the results of single reaction wells (100-105 copies are defined as standards). Number of reactions per qPCR: 0, 1, 3 copies, n = 24; 10 copies, n = 10; 100-105, n = 3. The assay shows reproducibly high sensitivity and specificity. With a single exception (E) all 120 negative controls reactions were negative.

