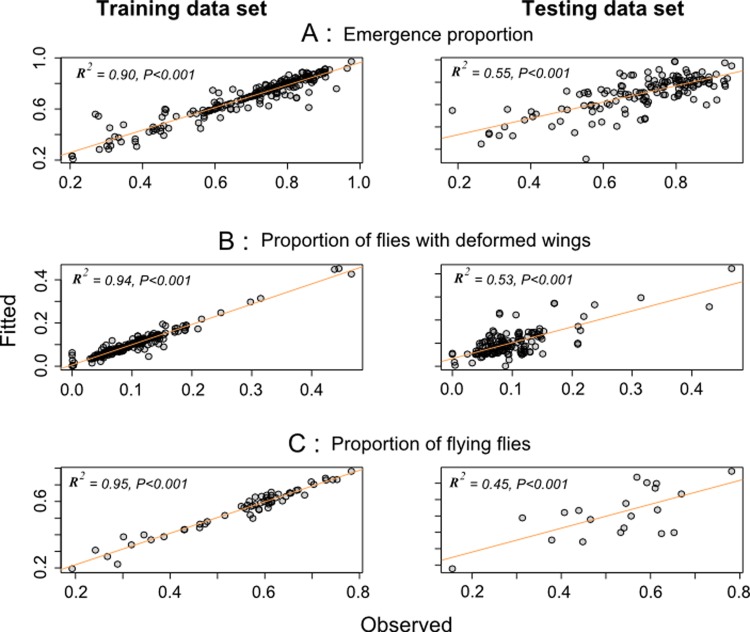
Fig 2. Relationship between the fitted and observed values of the quality assessment parameters.
(A) Emergence of pupae, (B) flies with deformed wings, and (C) flying flies from training and test sets of the QC and RF flies. The training set of each parameter (60% of emergence and flies with deformed wings data and 75% of flight ability data) was used to build the model and the test set (the rest of data) to measure the model performance. The fitted values were obtained from the binomial linear mixed model. The emergence rate, percentage of flies with deformed wings, percentage of flying flies within the QC group, their origins and batches were used as explanatory variables and the RF group parameters as explained variables with the shipment date as a random factor. The orange lines give the regressions.

