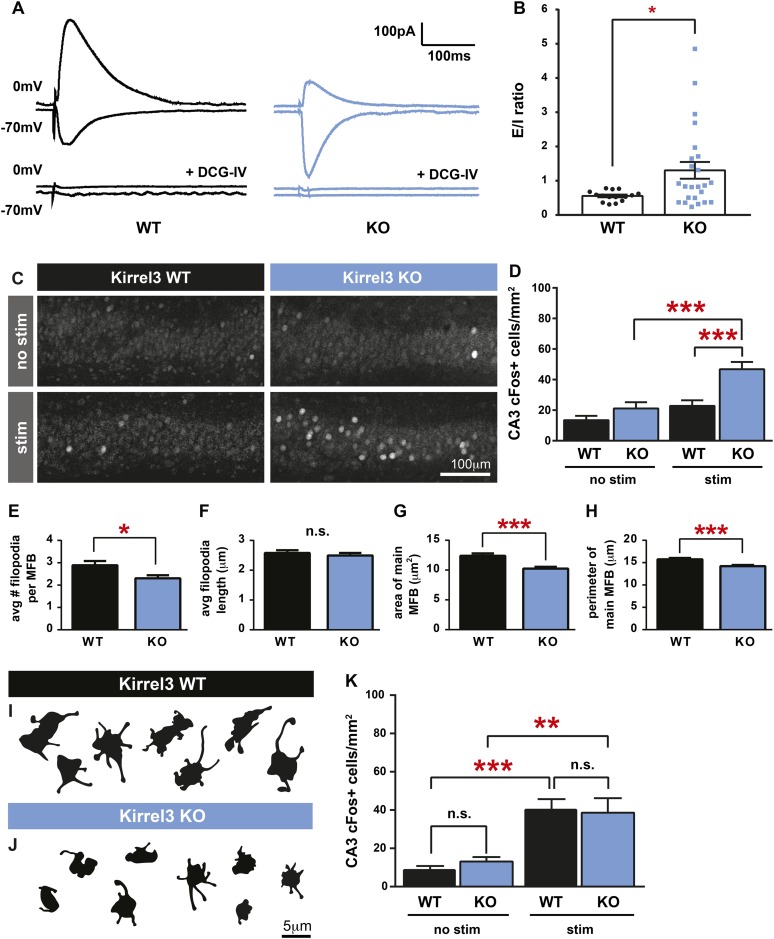
Figure 4. Kirrel3 regulates the activity of CA3 neurons during development.
(A) Evoked responses at −70 and 0 mV of a CA3 neuron after stimulation of the MF pathway in Kirrel3 WT and KO mice. Lower traces show responses of the same cells after perfusion of 0.5 μm DCG-IV. (B) Average excitatory/inhibitory (E/I) ratio for CA3 neurons recorded from P14–P16 WT and KO mice. n = 15 cells from five WT animals and 24 cells from five KO animals. p = 0.02 with unpaired t-test. (C) Examples of anti-cFos staining in CA3 neurons from P14 mice. Note increased cell staining in Kirrel3 KO mice after 25 min stimulation (stim) in a novel, enriched environment. (D) Quantification of cFos-positive CA3 neurons at P14. n = 14 (WT no stim), 15 (WT stim), 15 (KO no stim), and 15 (KO stim) sections from three mice per condition. Two-way ANOVA indicates there is a significant difference among condition (no stim vs stim) and genotype. p values from post-tests are 0.0001 (KO no stim vs KO stim) and 0.0004 (WT stim vs KO stim). (E–H) Quantification of MF synapse structure in adult mice. n = 115 WT and 131 KO synapses from three mice per genotype. Two-tailed t-tests indicate p = 0.01 (E), p < 0.0001 (G), and p = 0.002 (H). (I, J) Tracings of representative DiI-labeled MF synapses from adult (P60–P75) Kirrel3 WT and KO mice. (K) Quantification of cFos-positive cells in area CA3 of adult mice. n = 14 (WT no stim), 14 (WT stim), 16 (KO no stim), and 16 (KO stim) sections from three different mice per condition. Two-way ANOVA indicates there is a significant difference among condition (no stim vs stim) but not genotype. p values from post-tests are 0.0005 (WT no stim vs WT stim) and 0.003 (KO no stim vs KO stim). All graphs show mean ± SEM.


