
Fig 1. Schematic representation of protein expression and fitness of gene heterozygotes.
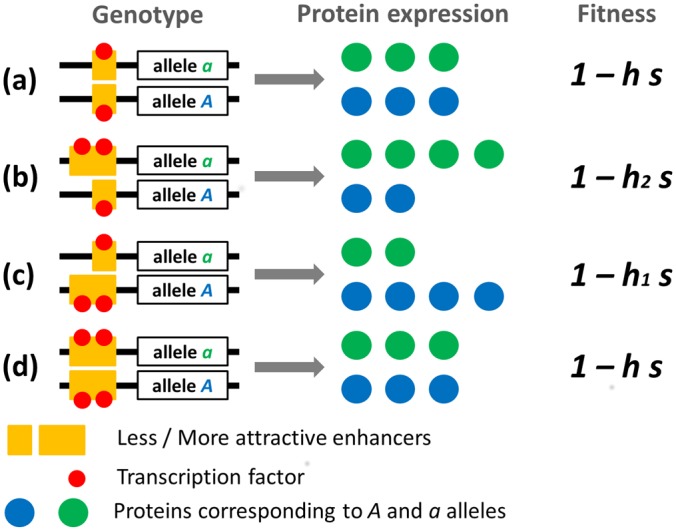
Here, the strengths of two enhancer alleles are represented by their ability to attract transcription factors. Four genotypes are represented: weaker enhancer homozygote (a), stronger enhancer homozygote (d) and enhancer locus heterozygotes (b) and (c). In enhancer locus heterozygotes, the stronger enhancer is either associated with the deleterious gene allele (b) or with the viable gene allele (c). Corresponding fitnesses are indicated. Note that we consider here a case where the total amount of proteins produced is constant.