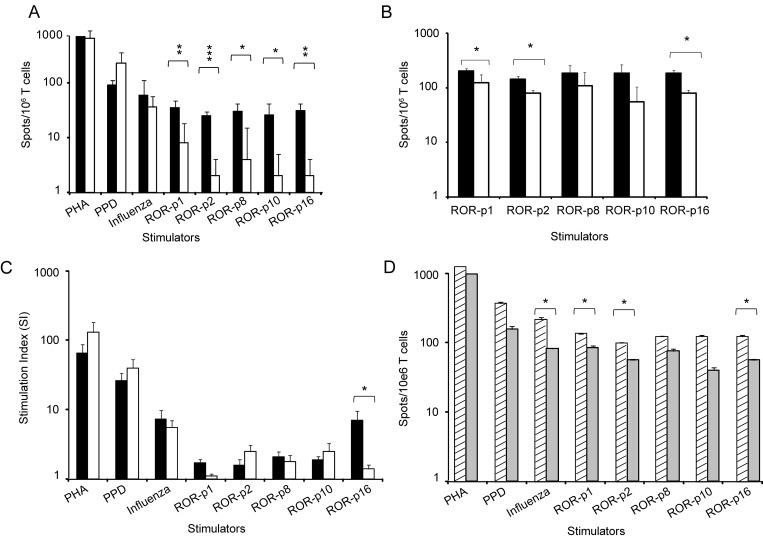
Fig 5. Frequency of T cells (spots/106 T cells) (mean + SEM) secreting (A) IFN-γ and (B) IL-17A (ELISPOT) and (C) stimulation index (SI) (proliferation) (mean + SEM) in response to PHA, PPD and autologous DC loaded with ROR1 derived peptides (p1, p2, p8, p10, p16) or an influenza peptide. (■) CLL patients (n = 9). (□) control donors (n = 6). (D) Frequency of IFN-γ T cells (spots/106 T cells) (ELISPOT) (mean + SEM) in non-progressive (n = 6) (▨) and progressive (n = 3) () patients.
Background values i.e. number of spots as well as SI after stimulation with an HIV (9 aa) and a Ras (16 aa) peptide were deducted in each experiment. *p<0.05, **p<0.001, ***p<0.0001.

