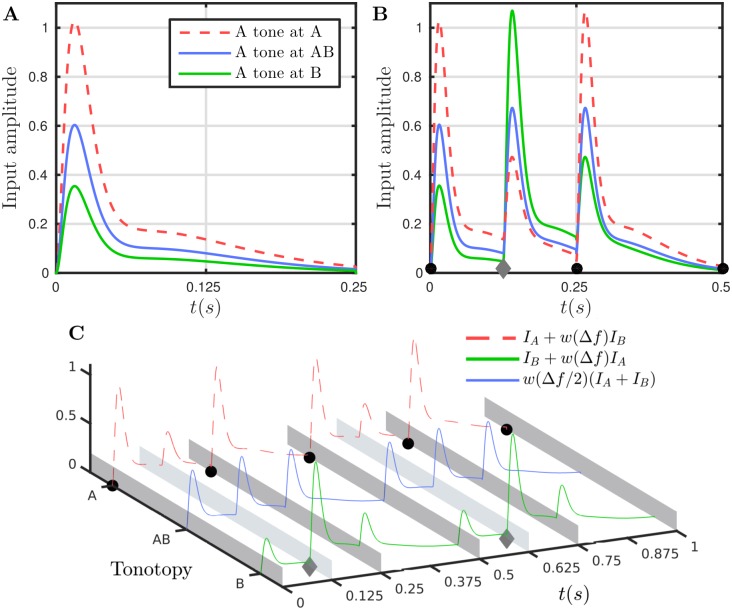
Fig 3. Model inputs.
A: Input time courses are represented by double alpha functions (see Model equations and details and Eq (8)) that capture the onset and plateau characteristics of A1-responses from [28]. For a single 125 ms tone of frequency A less input will arrive at locations AB and B than at A as described by Eq (7) and plotted here for Δf = 4 [26]. B: Inputs (see legend in C) to the respective populations r A, r B and r AB for an ABA- triplet of 0.5 s (tone duration and post-triplet silence “-” of 125 ms, i.e. PR = 8 Hz). Tone onsets: black circle for A-tone, gray diamond for B-tone. C: As B with curves distributed across the model’s tonotopy. The A-tone input is full amplitude at the A location, less at the AB location and further less at the B location, correspondingly for the B-tone input.

