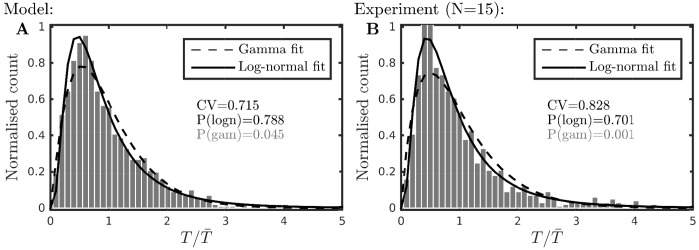
Fig 5. Statistics of dominance durations.
A: Histogram of 1000 durations from model simulations at Δf = 5 combined across perceptual type after normalising by the mean, see text. Curves show best-fit by gamma and log-normal distributions, P-values from one-way KS test are shown (in gray if the distribution can be rejected at the 0.05 significant level). B: As in A, here for the experimental condition Δf = 5; normalized data combined across subjects.

