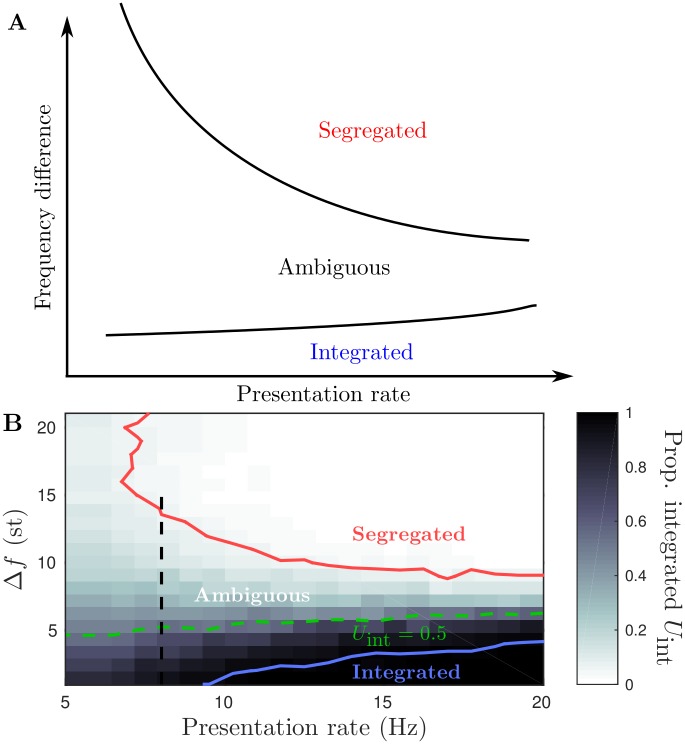
Fig 6. Perceptual organization for stimulus parameters.
A: Schematic diagram of the perceptual regions in terms of presentation rate and frequency difference, redrawn after [2]. B: Grayscale map of proportion (of time) integrated U int (see Eq (2)), segregated region is above red contour at U int = 0.05, integrated region is below blue contour at U int = 0.95, ambiguous region lies in between with equidominance at U int = 0.5 along the dashed green contour. Vertical dashed line at PR = 8 corresponds to the frequency difference sweep used later in Figs 8 and 9.

