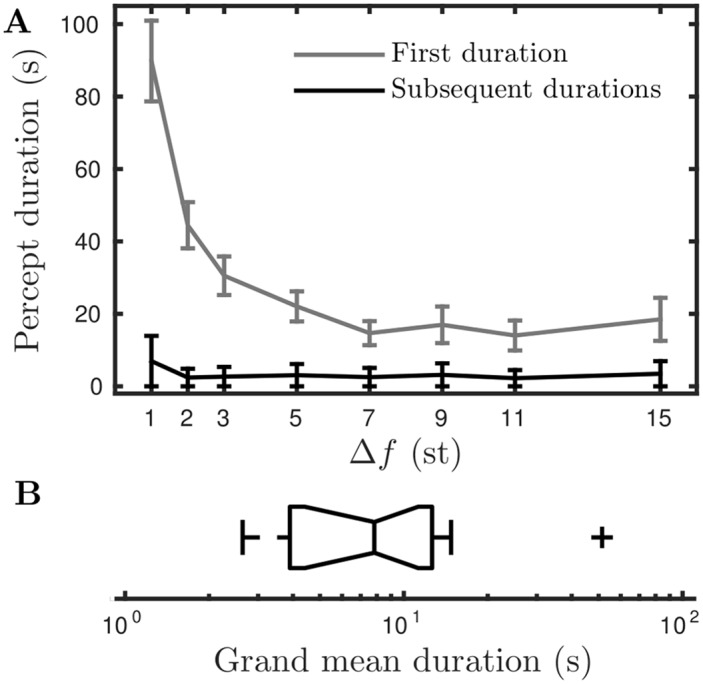
Fig 11. First and subsequent durations, summary statistics of the subject’s grand mean durations.

A: Mean first percept duration and mean subsequent percept duration for all durations combined across both percept types, N = 16 subjects and R = 3 repetitions. Error bars show standard error of the mean. B: Standard Tukey box plot of T glob for N = 16 subjects (box shows quartiles, whiskers are most extreme data points within 1.5 × iqr of the upper and lower quartiles, “+” are individual outliers).
