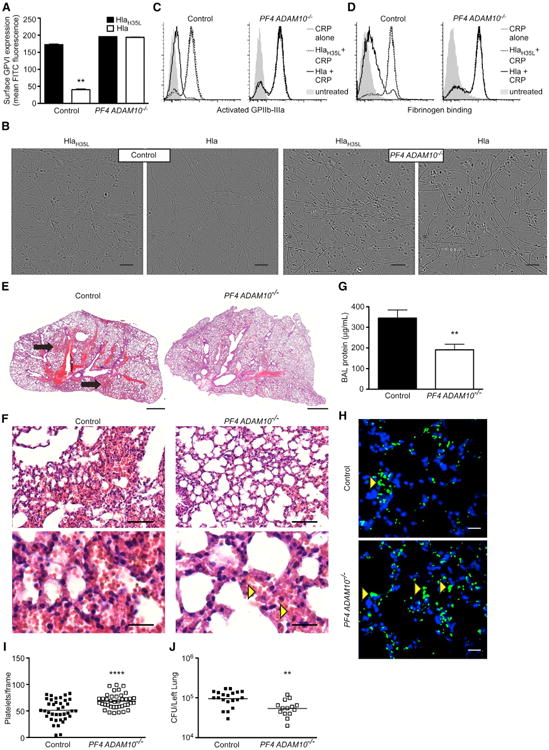
Figure 2. ADAM10 Alters Platelet Adhesive Properties in Response to Hla and Contributes to Sepsis-Associated Lung Injury.

(A) GPVI expression on control or PF4 ADAM10−/− platelets following treatment with HlaH35L or Hla, **p ≤ 0.01. Data are represented as mean ± SD.
(B) Adherence of control or PF4 ADAM10−/− platelets flowed over plate-bound collagen following treatment with HlaH35L or Hla. Scale bars, 10 μm.
(C) Analysis of activated GPIIb-IIIa expression on control (left) or PF4 ADAM10−/− (right) platelets pre-treated with Hla (black line) or HlaH35L (dotted line) followed by treatment with collagen-related peptide (CRP). CRP alone (gray line), untreated (gray shading) platelets served as controls.
(D) Binding of FITC-labeled fibrinogen to control and PF4 ADAM10−/− platelets treated as in (C).
(E) H&E-stained lung sections from control or PF4 ADAM10−/− mice 4 hr after infection with S. aureus USA300. Scale bars, 1,000 μm, and images representative of greater than three mice per condition from two independent experiments.
(F) Higher-magnification images of lung sections in (E), where yellow arrows demonstrate red cells in the vasculature of PF4 ADAM10−/−-infected mice. Scale bars, 100 μm (upper) and 20 μm (lower).
(G) Protein content in bronchoalveolar lavage (BAL) fluid from control (n = 12) and PF4 ADAM10−/− (n = 9) mice infected as in (E), **p ≤ 0.01.
(H) Platelets and nuclei (blue, dapi) in control or PF4 ADAM10−/− lungs 4 hr post infection as in (E). Scale bars, 10 μm.
(I) Quantification of platelets per frame from control or PF4 ADAM10−/− lungs (n = 3) of the images (n = 20) in (D).
(J) S. aureus colony-forming unit (CFU) recovery from lung tissue 4 hr after infection of control (n = 8) and PF4 ADAM10−/− (n = 9) mice as in (E), **p ≤ 0.01. Data are represented as mean ± SD; see also Figures S1 and S2.
