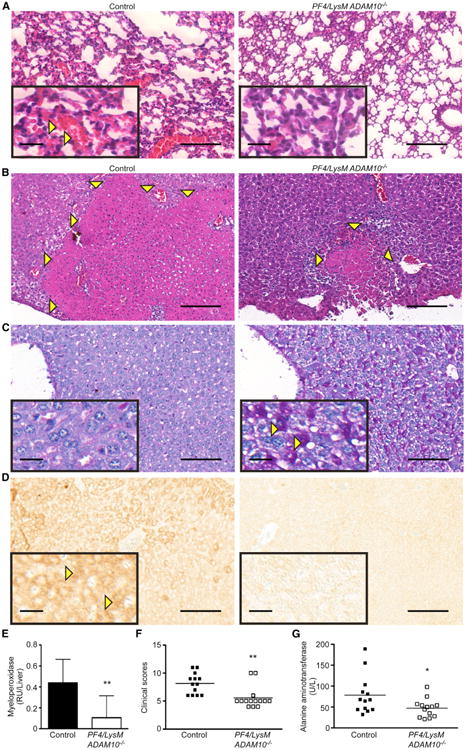
Figure 5. The Hla-ADAM10 Interaction on Platelets and Myeloid Cells Contributes to Multi-Organ Injury.

(A) H&E-stained lung sections from control or PF4/LysM ADAM10−/− mice 4 hr after intravenous S. aureus infection. Images representative of greater than three mice per condition from two independent experiments.
(B) H&E-stained liver sections from control or PF4/LysM ADAM10−/− mice 72 hr after infection.
(C) (C and D) Images of periodic-acid Schiff stain (PAS, C) or activated caspase-3 immunohistochemistry (D) of liver sections from mice as in (B). In (A)–(D) scale bars, 100 μm (larger image) and 20 μm (inset); images representative of greater than five mice per condition from two independent experiments.
(F) Liver myeloperoxidase activity in control (n = 16) or PF4/LysM ADAM10−/− (n = 10) mice as in (C). Data represent two independent pooled experiments, **p ≤ 0.01.
(G) Liver pathology scores from mice as in (B)–(D). Data represent two independent pooled experiments, **p ≤ 0.01.
(H) Serum alanine aminotransferase in infected control (n = 13) or PF4/LysM ADAM10−/− (n = 13) mice as in (C). Data represent two independent pooled experiments, *p ≤ 0.05. Data are represented as mean ± SD; see also Figure S6.
