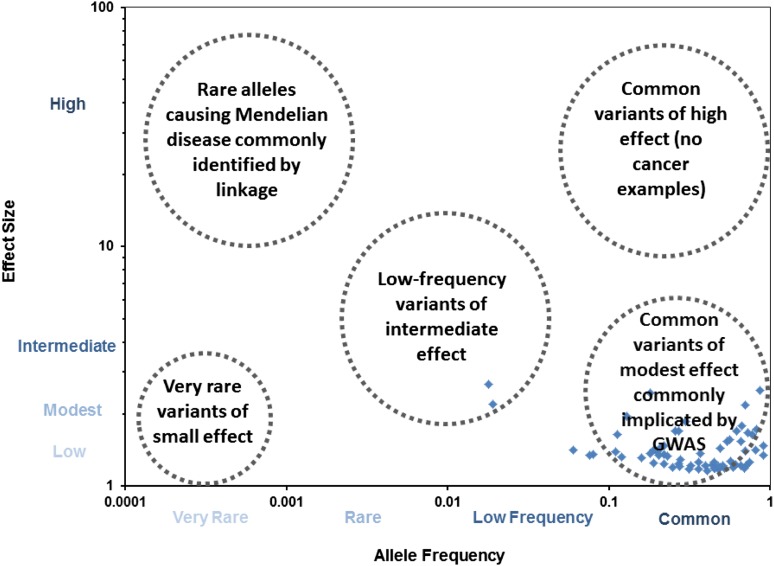
Figure 2.
Lymphoma susceptibility loci by effect size and AF. The blue diamonds represent established lymphoma susceptibility loci plotted by AF (x-axis) vs effect size (y-axis). For lymphoma, most of the loci are common variants of low to modest effect size (mainly discovered by GWAS), although a few low-frequency variants have been identified. No rare alleles of low frequency (generally identified through linkage studies and sequencing) have been definitively linked to lymphoma. Very rare variants of low effect size are difficult to identify using current genetic approaches, whereas there are very few examples of common variants of high effect size for common diseases (and none in lymphoma).

