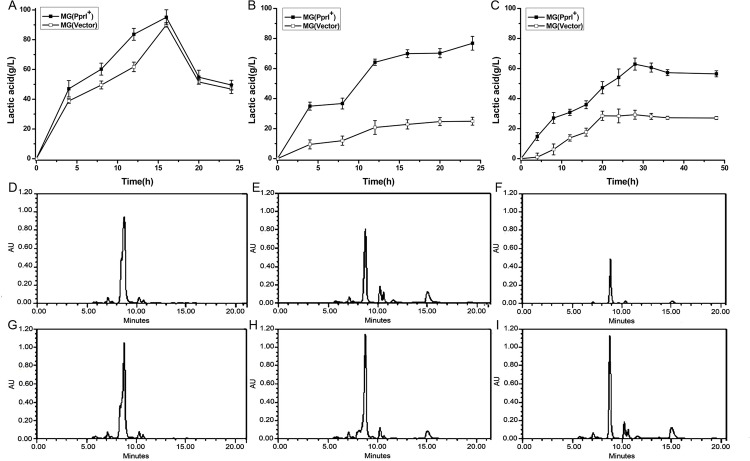
Fig 7. Lactic acid production of cell cultures from 0–24 h at 0%, 3%, and 5% NaCl.
(A–C). Values are presented as the mean±SD of three independent experiments. (D–F) HPLC analysis of lactic acid content in MG(Vector) cultures at 0%, 3%, and 5% NaCl, respectively, after 18 h. (G–I) HPLC analysis of lactic acid content in MG(PprI+) cultures at 0%, 3%, and 5% NaCl, respectively, after 18 h. Representative HPLC results from three independent analyses are shown. Lactic acid was identified by retention time compared with standard compound (lab stock). The amount of lactic acid was determined from the area under the peak detected at 240 nm using a calibration curve of lactic acid.

