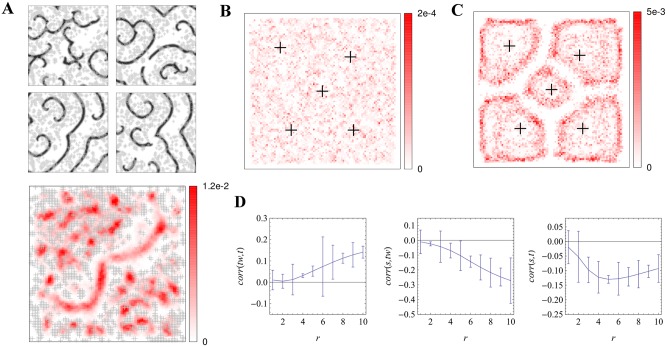
Fig 3. Effect of "pacemaker" location in the "Levine" model from [6,7].
Pacemaker locations are shown as grey or black crosses and spiral tip occupancy in the red scale. A: A conserved pacemaker pattern leads to different spiral wave patterns of excitability (upper row). Spiral tip occupancy over 1,000 runs favors locations free of pacemakers. The probability of observing a spiral wave at a particular spatial site is determined by the spatial distribution of cell properties. A simple pacemaker grouping gives rise to a less coherent, more variable tip occupancy in the Levine model compared to the clear geometric shaping in the "Goldbeter" model (C), based on 250 runs. D: Quantification of the relationships between pattern types in the Goldbeter model: over 100 runs, the correlation coefficient of (left to right) target wave origins to time offsets on the developmental path, spiral tips to target origins and spiral tips to time offsets; against the radius of the Gaussian filter.

