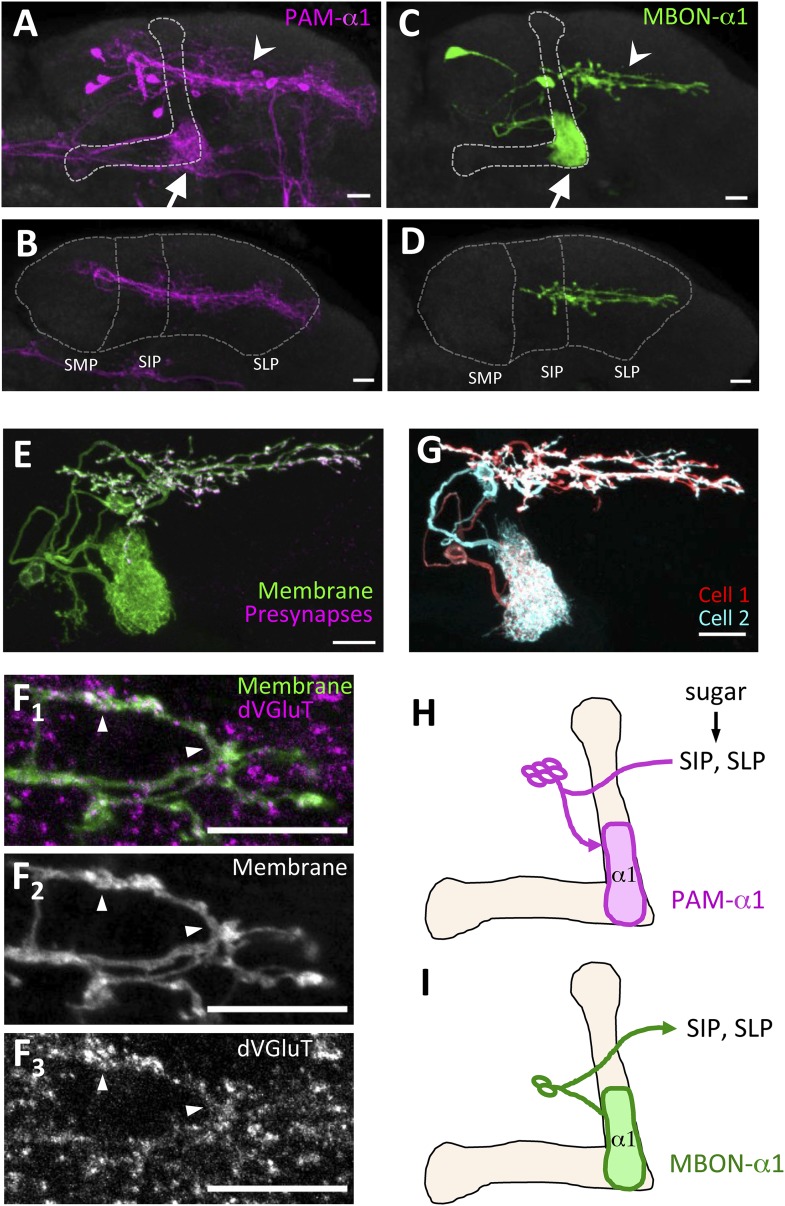
Figure 1. MBON-α1 receives inputs from MB-α1 and projects to the dendrites of PAM-α1.
(A–D) Anatomy of PAM-α1 (A, B) and MBON-α1 (C, D). Dotted line indicates α/β lobes in the mushroom body (MB) (A, C) or SMP, SIP, and SLP (superior medial, intermediate, and lateral protocerebra, respectively) (B, D). Arrows indicate α1 and arrowheads the SIP and SLP (A, C). PAM-α1 and MBON-α1 are visualized by pJFRC2-10xUAS-mCD8GFP in VK00005 and MB299B-GAL4 (A, B) or MB310C-GAL4 (C, D), respectively. (E) Presynaptic terminals of MBON-α1 are highly localized in SIP and SLP. MB310C-GAL4 is used to drive a general membrane marker (green) and a presynaptic marker (magenta) in MBON-α1. (F) Double labeling of the membrane of MBON-α1 (green) and anti-vesicular glutamate transporter (dVGluT, magenta) (F1), membrane staining (F2), and anti-dVGluT staining (F3). Arrowheads highlight the overlap. (G) Two individual MBON-α1 neurons visualized by multi-color flip-out with different colors (red and cyan). (H, I) Schematics of PAM-α1 and MBON-α1, respectively. The α/β lobe of the MB is outlined with light orange. Scale bars, 10 µm.


