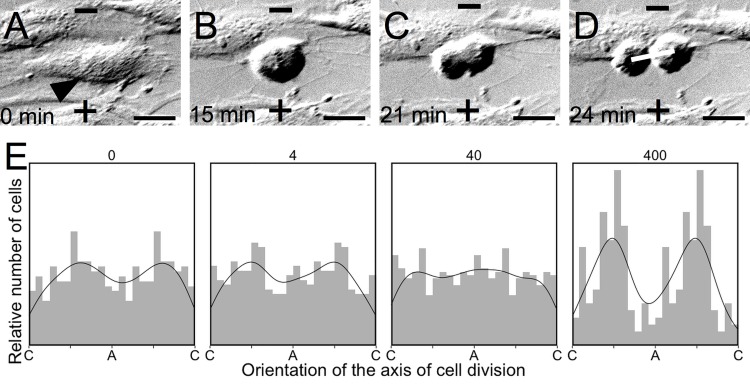
Fig 8. Electric field exposure aligns the axis of cell division.
(A-D) Mitotic cells (arrow, A) were identified in time-lapse DIC microscopy videos. The axis of division was defined for each cell by drawing a line through the center of each of the daughter nuclei in the first frame where they become distinctly visible (line, D) and measuring the angle of this axis relative to the applied EF (cathode (-) at the top of each image, anode (+) at the bottom of each image). The time (in minutes) of each image is provided to illustrate the duration of mitosis. Scale bar = 20 μm. (E) Frequency histograms representing the relative number of nuclei counted at each orientation relative to the anode (A) and cathode (C) (histogram bin width of 15°), with a density curve super-imposed on each graph. Orientation of the mitotic axis is double-plotted along the x-axis relative to the anode (A) and cathode (C) to aid in observing the alignment of these data.

