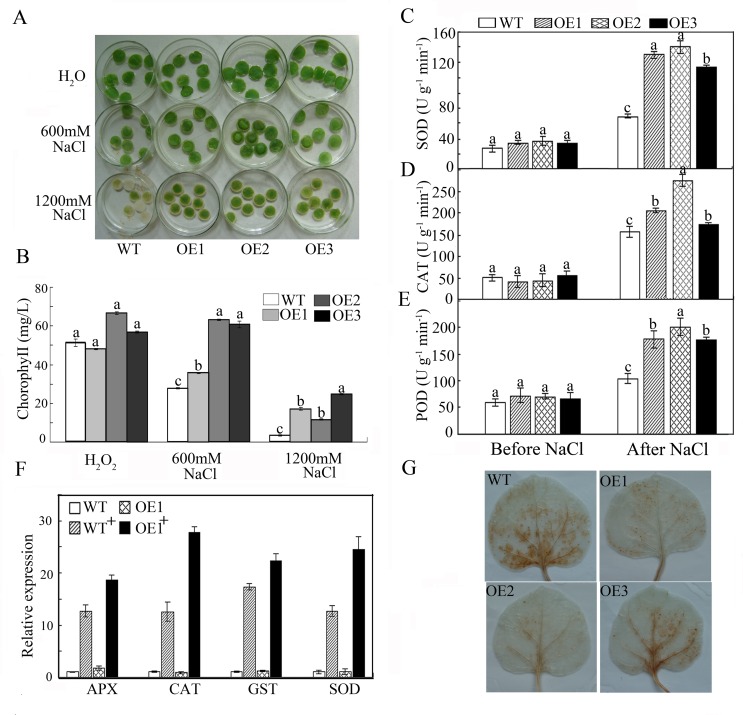
Fig 7. Salt tolerance of WT and GhWRKY41-overexpressing N. benthamiana plants in the vegetative stage.
(A) Leaf discs from WT and OE plants were incubated with NaCl at different concentrations (0, 600 or 1,200 mM) under greenhouse conditions. (B) Relative chlorophyll content was determined in the leaf discs of WT and OE plants following NaCl treatments. Disks floated in water were used as controls. The presented data are the means ± SE of three independent experiments (n = 6). (C-E) Analysis of stress-related enzyme activity. (F) Expression levels of stress-related genes. WT+ indicates the WT lines after NaCl treatment. OE1+ indicates the OE1 lines after NaCl treatment. (G) Salt-induced H2O2 accumulation detected via DAB staining.

