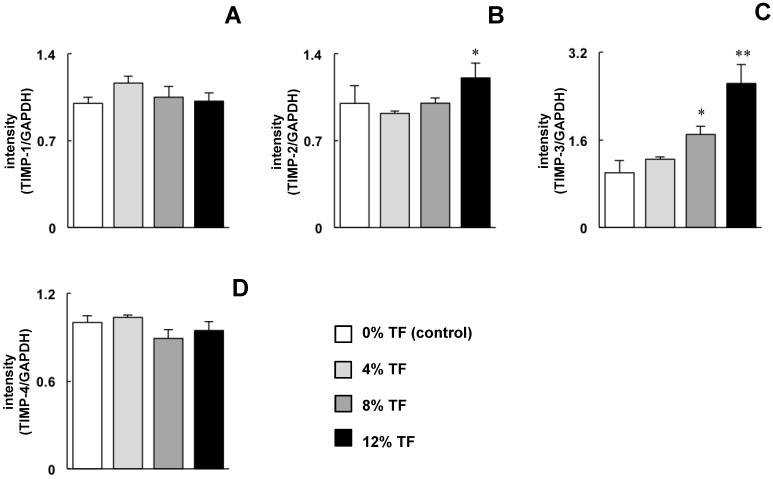
Fig 2.
Effect of TF on TIMP mRNA expression. MC3T3-E1 cells were subjected to 0% (control), 4, 8, or 12% TF for 24 hours, and the expression of TIMP-1 (A), -2 (B), -3 (C) and -4 (D) was determined using real-time RT-PCR. Gene expression is described as the fold change relative to the control group. Each bar indicates the mean ± SD from three independent experiments. **p < 0.01, *p < 0.05 (vs. control).

