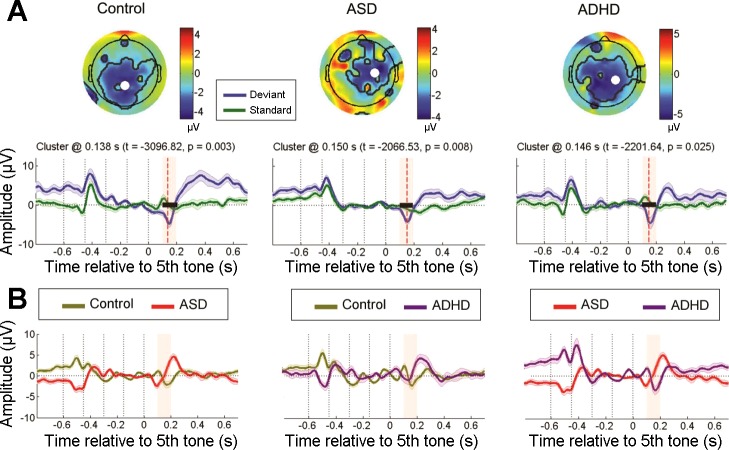
Fig. 2.
Bottom-up processing indexed by the mismatch negativity (MMN). A: within-group differences between monaural deviant and monaural standard conditions for each group. Top plots show the spatial topography of the cluster at the time point of maximal difference between the pair of conditions. Thick black lines outline the spatial extent of the cluster, and the white dot therein indicates the electrode at which the maximum difference was observed. Bottom plots show grand-average event-related potential (ERP) time courses at this electrode in microvolts. Shaded bars around the ERPs indicate SE. The thick black horizontal line indicates the temporal extent of the significant cluster, and the red dashed vertical line depicts the time point at which the topography above is plotted (only when significant clusters were found). This time point is also specified above the plot, in addition to the Monte Carlo t and P values of the cluster. The pink-shaded rectangular box indicates the time window within which the conditions/groups were compared. Vertical black dotted lines indicate the onset of each of the 5 tones in the sequence. B: between-group differences in monaural deviant condition in the MMN temporal window. The plots depict time courses of the cluster at the electrode in which maximal differences between groups were observed for this condition. No significant differences were observed in these group comparisons. ASD, autism spectrum disorder; ADHD, attention deficit hyperactivity disorder.

