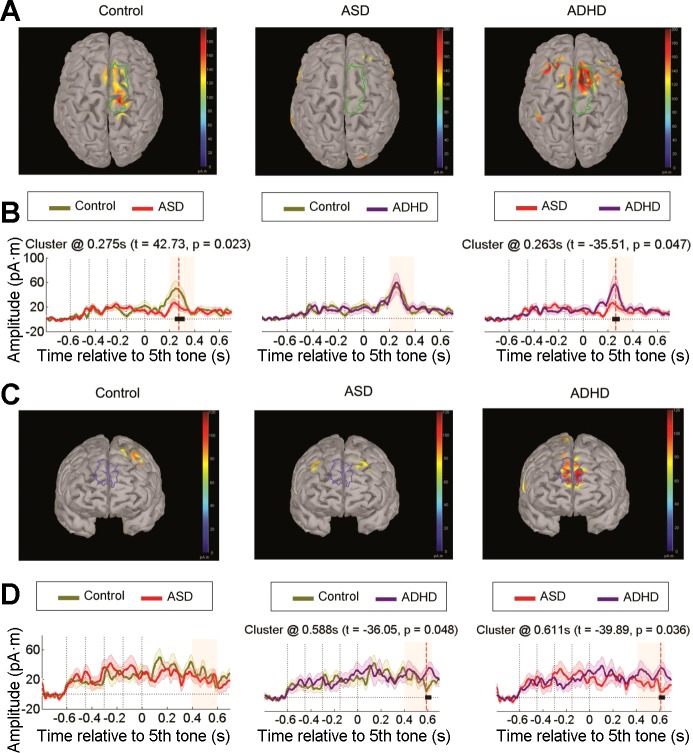
Fig. 6.
Source reconstruction for unexpected deviant sequences. A: cortical activation maps at the P300 peak for each group at the right superior frontal cortex. B: activation time courses in picoampere-meters, comparing group differences for the previous ROI by cluster analyses (see Fig. 2 for details). C: cortical activation maps at the late phase of the P300 showing stronger responses in the prefrontal cortex (bilaterally) in the ADHD group. D: activation time courses for group differences in this ROI by cluster analyses.

