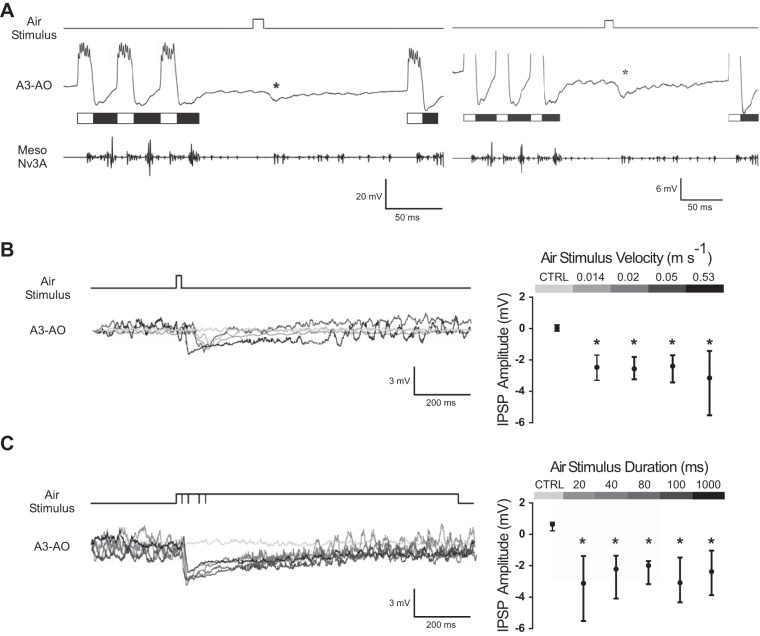
Fig. 2.
Rhythmic motor activity and synaptic response of the A3-AO interneuron to air currents delivered to the cerci during fictive singing. White and black bars indicate the opener and closer phases of the A3-AO activity, respectively. A: example of the inhibitory postsynaptic potential (IPSP; indicated by asterisks) in the A3-AO to a 20-ms air stimulus presented in the interchirp interval. The air-evoked IPSP is smaller than the inhibition occurring during the closer phase (black bars). Vertical scale bars refer only to the intracellular recording of A3-AO. B, left: applying air stimuli of different velocities leads to similar IPSP amplitudes, although with longer IPSPs for faster stimuli; light gray line represents the membrane potential of the A3-AO where no stimulus was applied. Right: median and interquartile range (IQR; 25th and 75th percentiles) of the inhibitory response to the control (CTRL; average membrane potential 100 ms prior to all stimuli) and different stimuli velocities (N = 3 and n = 90 for low-velocity stimuli and N = 5 and n = 50 for high-velocity stimuli; *P < 0.05) are shown. C, left: applying air stimuli of different durations induces similar IPSPs; light gray line represents the membrane potential of the A3-AO where no stimulus was applied. Right: median and IQR (25th and 75th percentiles) of the inhibitory response to the control (average membrane potential 100 ms prior to all stimuli) and different stimuli durations (N = 5 and n = 50 for 20- and 80-ms stimuli durations and N = 7 and n = 70 for 40-, 100-, and 1,000-ms stimuli durations; *P < 0.05) are shown. In B and C, the inhibition amplitude was calculated from the difference between the average membrane potential 100 ms prior to the stimulus and the maximum inhibition. In the averaged membrane potential, oscillations of the signal are due to rhythmic A3-AO activity, when the crickets resumed singing after the air stimulus.

