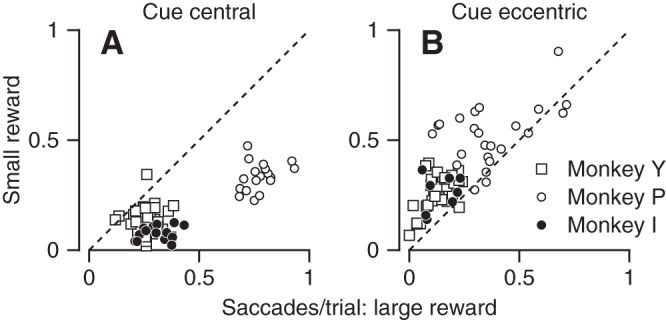
Fig. 3.

Quantitative summary of the effects of reward on the rate of microsaccades. Each symbol shows data from 1 experimental session. A and B: scatter plots of the number of saccades per trial when the monkey was cued for a small vs. large reward. Plots in A and B correspond to sessions when the cue appeared at a central or eccentric location, respectively. Different symbol shapes show data for different monkeys. Each symbol shows data from a single recording session and single motion direction. Only data from conditions with more than 50 trials are included.
