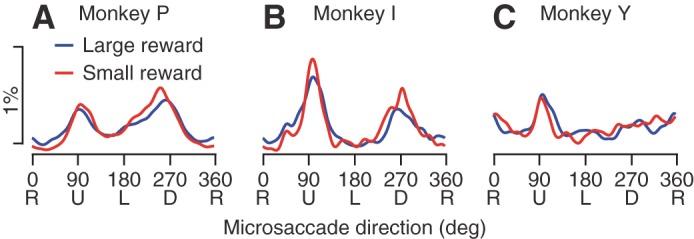
Fig. 6.

Intrinsic anisotropy in the direction of microsaccades. A–C: plots show the percentage of microsaccades in each direction in the first 500 ms after the appearance of the colored cue for reward size. Percentages were calculated in bins of 1° and smoothed circularly by a Gaussian kernel with an SD of 5°. Blue and red traces show results when the monkey was expecting a large vs. small reward, respectively. The colored cue always appeared at a central location to preclude biases in microsaccade direction. Different plots show data from different monkeys.
