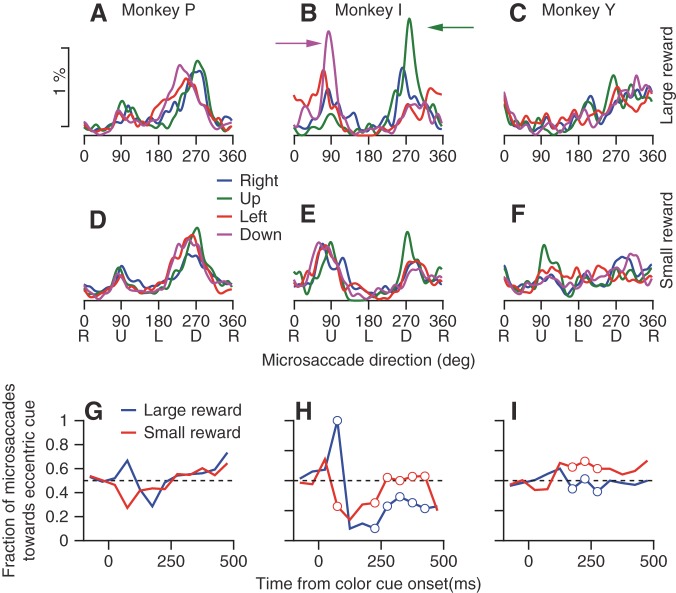
Fig. 7.
Absence of consistent biases in microsaccade direction related to the location of an eccentric cue. A–F: each graph shows the distribution of the directions of microsaccades in the first 500 ms after appearance of the colored cue. Different colored traces indicate the location of the colored cue relative to the position of fixation. Columns of panels at left, middle, and right show data for monkeys P, I, and Y. Rows of panels at top and bottom show the results when the monkey was cued to expect a large vs. a small reward. Percentages were calculated in bins of 1° and smoothed circularly by a Gaussian kernel with an SD of 5°. G–I: each graph shows the percentage of microsaccades that were directed toward the hemifield of the eccentric cue. Blue and red curves correspond to trials with large and small rewards, respectively. Open circles mark bins in which the fraction of microsaccades toward the hemifield of the cue were significantly different for large and small rewards (P < 0.05, χ2 test).

